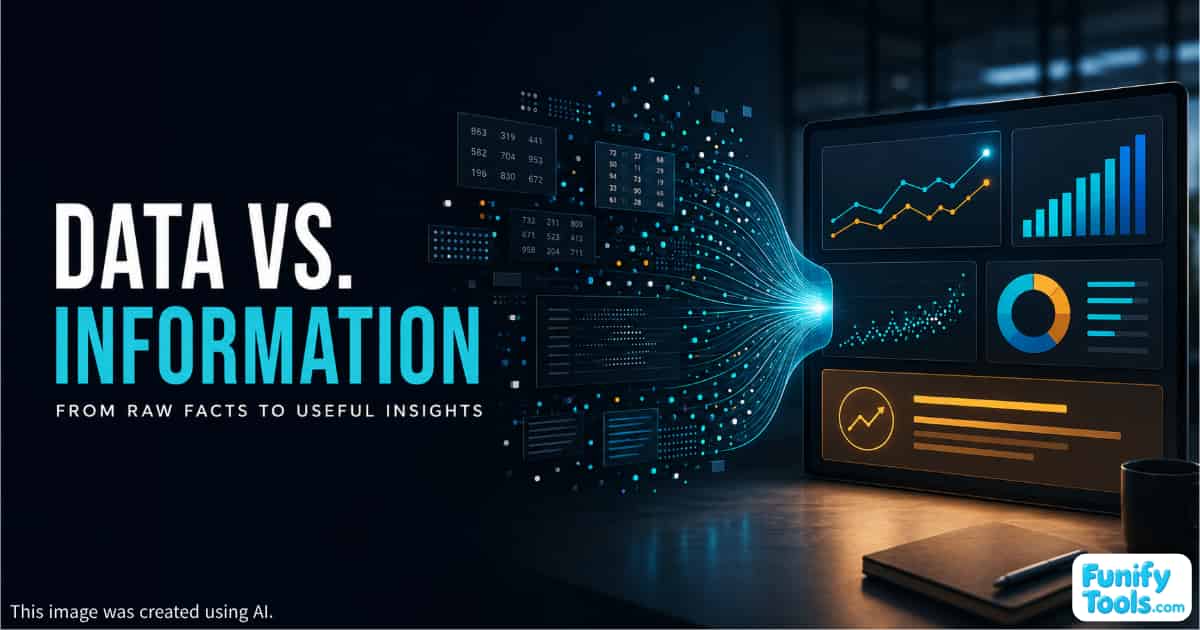
If you work in IT, you probably hear—and use—the words data and information all the time. They are sometimes treated as if they mean the same thing, but there is an important difference between them.
Data consists of raw facts or records that have not yet been given a clear meaning. It might be a number, a sensor reading, or a log of something a customer clicked. These values describe something that happened, but on their own, they may not tell you what to do next.
Information, by contrast, is data that has been processed for a particular purpose. Context, comparisons, and interpretation have been added so that the result can be clearly explained and used to make a decision.
A simple way to remember the difference is this:
If it only tells you what happened or how much there was, it is data. If it also tells you what that means and what you can do about it, it is information.
Let's look at a few examples.
Examples of Data and Information
Suppose a student studied for 12 hours in one week. That is data.
Now suppose we add that the student's English performance improved, but their grammar score remained unchanged, so they should spend more time on grammar over the next two weeks. That is information because interpretation and a recommended action have been added to the original number.
Here is another example.
Saying that a website received 10,000 visitors today is data. The number may seem high or low, but without context, it is difficult to know whether the result is good.
If we add that traffic increased by 18% compared with yesterday and that 70% of visitors arrived through search engines, the data becomes information. We can now begin to understand what caused the increase, which traffic channel might deserve more attention, and what should be monitored over the coming week.
An easy way to understand the distinction is that data shows what is happening, while information helps determine what to do next.
How Data Becomes Information
When we create reports, we usually begin by collecting data and then convert it into information.
This process involves bringing scattered values together, handling missing entries, standardizing units, establishing comparison criteria, and presenting the result through language and visuals that readers can understand immediately.
If data is not properly transformed into information, the quality of the document suffers.
That is why reports filled with tables and numbers can still be frustrating to read. There may be plenty of data, but no clear benchmark. Without a benchmark, it is difficult to identify priorities. Without priorities, meaningful decisions become almost impossible.
The result is an awkward document that contains plenty of numbers but does not function effectively as either raw data or useful information.
A Chart Is Not Automatically Information
A common mistake is assuming that data becomes information simply because it has been placed in a chart. The same problem occurs when someone calculates an average and assumes that no further analysis is necessary, or writes a long explanation and expects it to be persuasive.
Useful information needs a reference point.
Did performance improve compared with last month? Did the result exceed the target? How does it compare with the industry average?
The conclusion should also be summarized in one or two clear sentences.
For example:
This month's conversion rate increased after we redesigned the first screen of the mobile experience, so we should test the same approach in other product categories.
That is information. It connects a result to a likely cause and recommends a specific next step.
Why the Difference Matters When Working in Teams
The distinction between data and information becomes even more important when working as part of a team.
In many organizations, one person collects and cleans the data while another interprets and communicates it. When everyone understands the criteria for turning data into information, reports become shorter and meetings become more efficient.
A practical report can follow a simple structure:
- Describe the result in one sentence.
- State the benchmark used for comparison.
- Add a hypothesis explaining why the result occurred.
- Finish with the next action and its deadline.
Following this structure helps a person or team move beyond simply presenting numbers. They become someone who helps the organization make decisions.
Data Is the Ingredient; Information Is the Finished Meal
In simple terms, data is the raw ingredient, while information is the finished meal.
Having more ingredients can be useful, but they cannot always be consumed as they are. They must be prepared, combined, and shaped for a particular purpose.
The same is true of data. When you collect it, refine it, compare it with the right benchmarks, and explain what it means, the result becomes far more valuable.
Even when two people begin with exactly the same numbers, the person who turns those numbers into clear information will usually produce a more readable report and a more persuasive explanation.
The next time you create a document or report, take a moment to ask yourself whether you are simply presenting data—or providing information that helps someone decide what to do next.
Thank you for reading, and I hope you have a wonderful day!
This article is also available in Korean: Read the Korean version