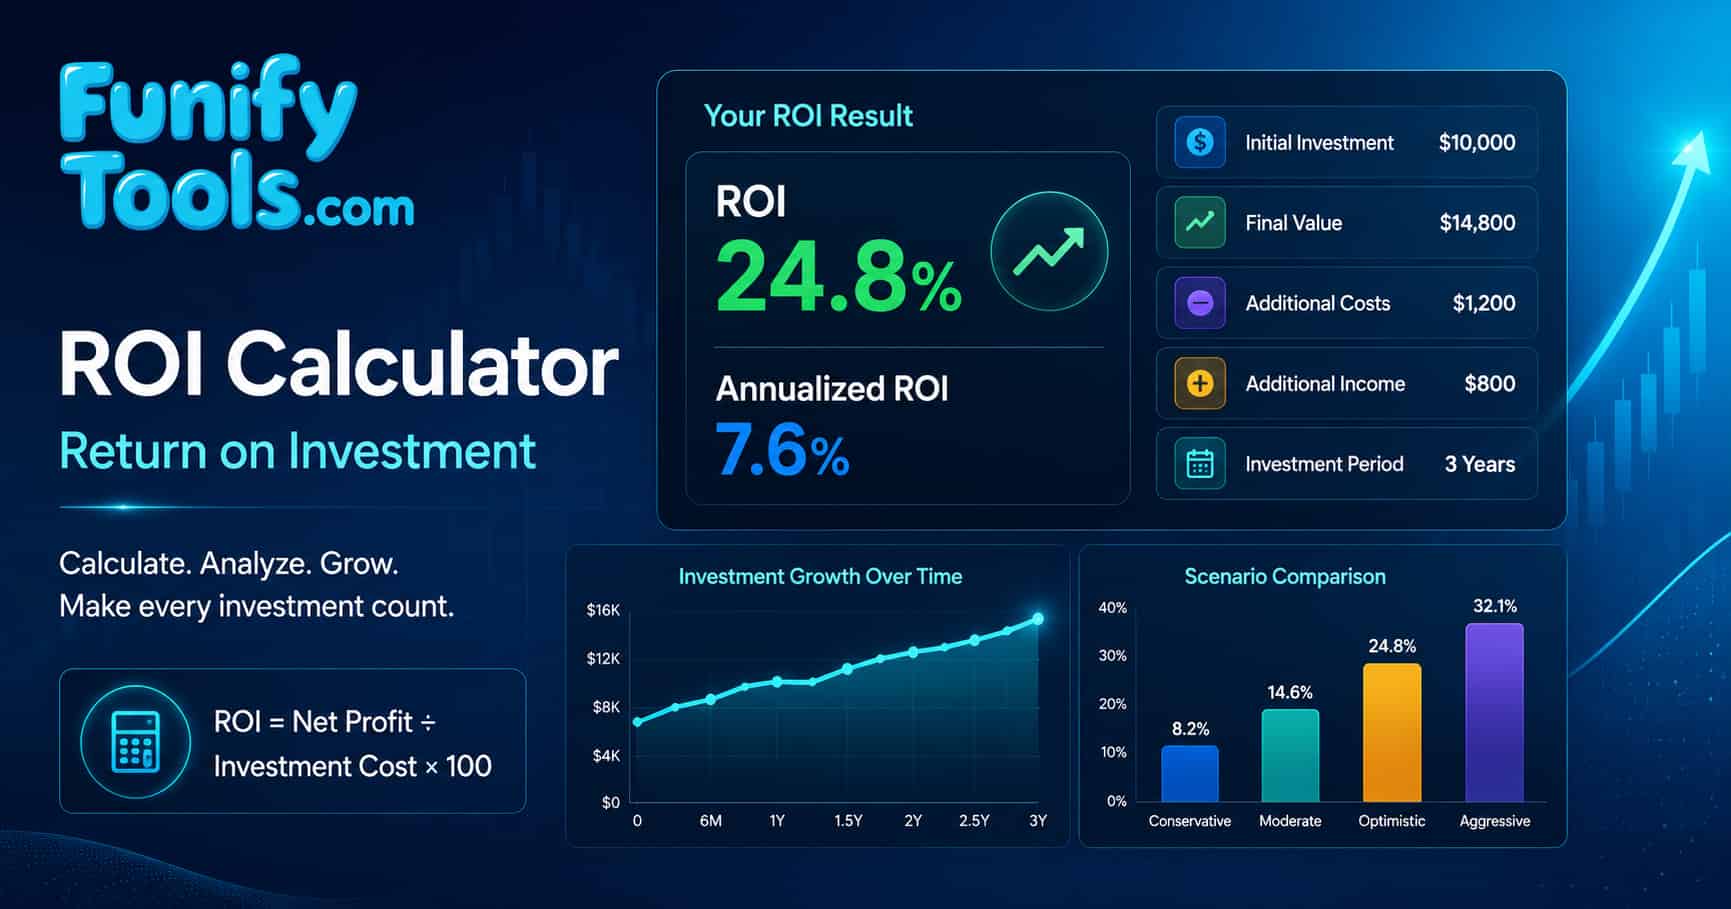
What ROI is
Return on investment is a profitability ratio that compares net profit with the full investment cost basis.
Formulas used on this page
Cost basis = Initial investment + Additional costs
Net profit = Final value - Initial investment + Additional income - Additional costs
ROI (%) = Net profit / Cost basis 횞 100
Annualized ROI (%) = [(1 + ROI)^(1 / years) - 1] 횞 100
Interpreting results
A positive ROI indicates profit and a negative ROI indicates loss. Annualized ROI is useful when comparing investments with different holding periods.
Limitations
ROI does not fully represent risk, volatility, liquidity, taxes, inflation, or non-financial benefits.
Worked ROI calculation example
Suppose an investor pays $10,000 for an asset, spends another $500 on transaction and improvement costs, receives $300 of additional income, and sells the asset for $13,000 after two years. A complete ROI calculation includes every one of these amounts instead of comparing only the purchase price and sale price.
| Item | Amount | How it affects ROI |
|---|---|---|
| Initial investment | $10,000 | Included in the cost basis |
| Additional costs | $500 | Raises cost basis and reduces net profit |
| Final value | $13,000 | Represents the ending or sale value |
| Additional income | $300 | Raises net profit |
| Holding period | 2 years | Used to calculate annualized ROI |
The full cost basis is $10,500. Net profit is $2,800, calculated as $13,000 - $10,000 + $300 - $500. Dividing $2,800 by the $10,500 cost basis produces an ROI of approximately 26.67%. Because the gain took two years, the annualized ROI is lower than the total ROI.
Total ROI versus annualized ROI
Total ROI measures the complete return over the entire holding period. Annualized ROI converts that return into an equivalent compounded yearly rate. This distinction matters because a 30% return earned in one year is very different from a 30% return earned over ten years.
| Metric | Best used for | Main limitation |
|---|---|---|
| Total ROI | Measuring the complete gain or loss | Does not show how quickly the return was earned |
| Annualized ROI | Comparing different holding periods | Smooths volatility into one compounded yearly rate |
Annualized ROI does not mean the investment earned the same return every year. Actual performance may rise sharply in one period and fall in another while producing the same final annualized result. Use both total and annualized ROI when reviewing long-term investments.
How to compare investment opportunities fairly
Use consistent assumptions for every option. Include equivalent cost categories, measure returns over comparable periods, and distinguish forecast values from realized values. The scenario comparison table can help test how changes in purchase price, final value, expenses, income, or holding period affect the result.
| Comparison factor | Question to ask | Why it matters |
|---|---|---|
| Return | What are total and annualized ROI? | Shows the size and speed of the gain |
| Risk | How uncertain are income and final value? | Higher expected returns may involve greater loss potential |
| Liquidity | How quickly can the investment be sold? | An attractive return may be difficult to realize |
| Capital required | How much money is committed? | A higher ROI can still create less total profit |
| Effort and time | Does it require active management? | Unpaid labor can overstate the apparent return |
Costs and income commonly missed in ROI calculations
ROI can be overstated when important expenses are omitted. Identify every cash outflow required to purchase, operate, improve, and sell the investment. Include income received during the holding period, not only the final sale value.
- Investment and trading: commissions, platform charges, advisory fees, and taxes.
- Property: closing costs, repairs, insurance, maintenance, vacancy, and selling fees.
- Business projects: labor, software, advertising, training, support, and opportunity cost.
- Equipment: installation, financing, maintenance, energy, downtime, and resale value.
- Additional income: dividends, interest, rent, rebates, incentives, and residual value.
Use the additional costs and additional income fields to create a more complete estimate. When comparing scenarios, keep the treatment of financing and taxes consistent so one option is not given an artificial advantage.
How to interpret a good or bad ROI
There is no universal ROI percentage that is good for every investment. The appropriate target depends on risk, market conditions, inflation, available alternatives, and the investor's required return. A lower-risk investment may be acceptable with a modest return, while a speculative project may need a much higher expected return to justify its uncertainty.
| ROI result | Basic interpretation | Useful follow-up |
|---|---|---|
| Negative ROI | The investment lost money | Review costs, exit value, and assumptions |
| Zero ROI | The investment approximately broke even | Check inflation, taxes, and opportunity cost |
| Positive ROI | The investment produced a nominal gain | Compare annualized return, risk, and alternatives |
| Very high ROI | The gain is large relative to cost | Verify inputs and test conservative scenarios |
Practical ways to use an ROI calculator
ROI analysis is useful whenever a measurable cost is expected to create a measurable financial benefit. It can compare investments, evaluate renovations or equipment upgrades, estimate marketing campaign profitability, and test business projects or cost-saving initiatives.
- Compare optimistic, expected, and conservative scenarios before committing capital.
- Measure marketing return using incremental profit rather than revenue alone.
- Test whether a higher-cost option creates enough additional value to justify its price.
- Compare realized performance with the original forecast after an investment ends.
- Evaluate how a longer or shorter holding period changes annualized performance.
For forecasts, avoid relying on a single result. Change the final value, costs, income, and holding period to see how sensitive the outcome is to uncertain assumptions. A project that remains acceptable under conservative assumptions may be more resilient than one that works only in the best case.
When ROI is not enough
ROI does not directly measure volatility, probability of loss, liquidity, financing structure, inflation, taxes, or the timing of multiple cash flows. It also cannot show whether an investment required significant unpaid work or prevented the capital from being used elsewhere.
For investments with deposits, withdrawals, or income at many different dates, consider cash-flow based metrics such as internal rate of return (IRR) or net present value (NPV). Combine ROI with payback period, cash flow forecasts, risk analysis, and strategic considerations.
ROI analysis checklist
- Define a clear starting value, ending value, and measurement period.
- Include all purchase, operating, improvement, and exit costs.
- Include income received during the holding period.
- Compare both total ROI and annualized ROI.
- Use consistent assumptions across every scenario.
- Test conservative and adverse cases, not only the expected case.
- Review risk, liquidity, taxes, inflation, and opportunity cost before deciding.