What it measures
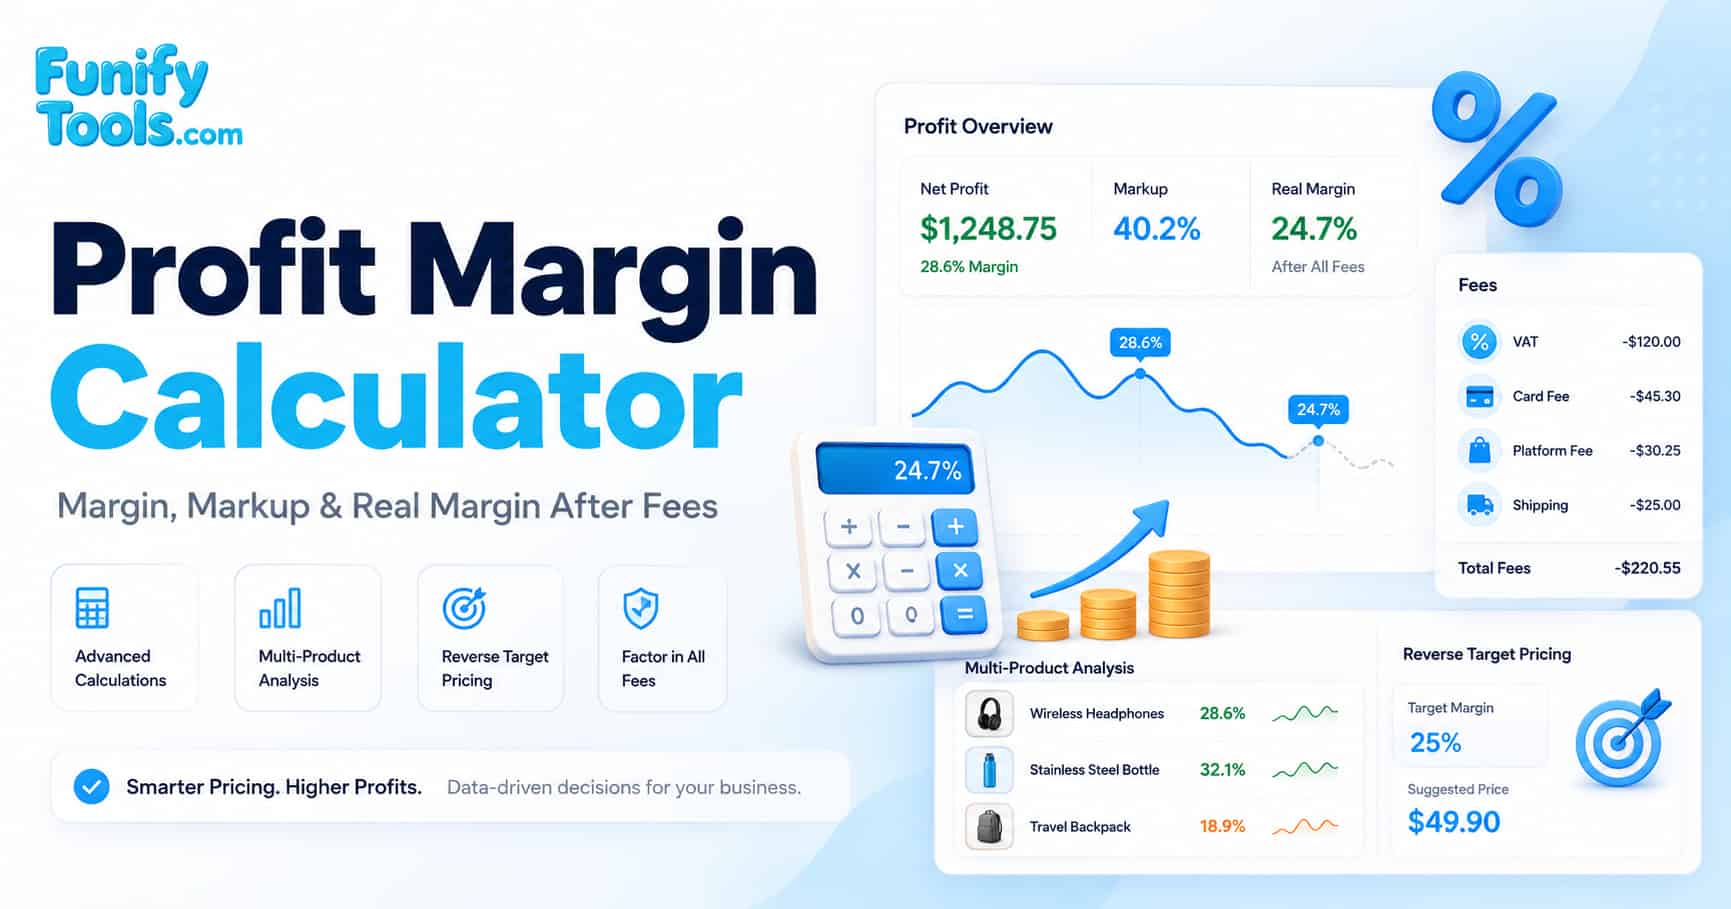
This advanced profit margin calculator helps businesses, e-commerce sellers, retailers, and independent makers analyze profitability across multiple products, account for taxes and transaction fees, and determine optimal pricing strategies using reverse margin calculations. It provides clear visualizations to compare cost, profit, margin, markup, and the estimated fee impact before you change a price or publish a product listing. Understanding profit margin is essential for sustainable business growth because it directly affects cash flow, reinvestment capacity, and long-term competitiveness. A business that tracks margin closely can identify which products drive real profit and which ones may be eroding overall returns when all costs and fees are included. For a broader perspective on how margin analysis fits into financial management, you can search Google for profitability analysis financial metrics for business and compare the key ratios used by accountants and analysts.
Standard mode
Standard mode calculates product profitability from sales price, cost, and quantity. It then adjusts the result for VAT, card fees, platform fees, and shipping cost per unit. This mode is ideal when you already know or have estimated your selling price and want to evaluate how much profit remains after all deductions. For broader pricing context, compare your assumptions with a Google search for product pricing strategy and profit margin to see how your numbers align with common industry benchmarks.
- Total revenue is the sum of price times quantity for all products.
- Total cost is the sum of cost times quantity for all products.
- Gross profit is revenue minus cost, before any fee or tax deductions.
- Total fees include VAT, card fee, platform fee, and shipping cost multiplied by quantity.
- Real profit is gross profit minus total fees, giving the most realistic view of take-home earnings.
- The category field helps group products for comparison across product types or sales channels.
Product rows are shown individually so you can see which items contribute the most profit and which items lose more margin after fees. This granular view is especially useful when you sell across multiple categories such as apparel, electronics, home goods, or digital products, because each category may carry different cost structures and fee profiles.
| Input area | What to review | Why it matters |
|---|---|---|
| Price | Confirm the actual selling price before discounts. | Discounts lower revenue and can reduce real margin quickly. |
| Cost | Include the direct unit cost used for the product. | Understated cost makes margin look stronger than it is. |
| Fees | Check VAT, card fee, platform fee, and shipping assumptions. | Fee deductions explain the gap between gross margin and real margin. |
| Quantity | Use the quantity for the batch or scenario you want to compare. | Quantity changes revenue, cost, shipping, and total profit at the same time. |
Reverse mode
Reverse mode is for pricing from the target backward. Instead of entering a selling price, you enter product cost and the target margin percentage. The calculator returns the price needed to hit that margin, along with the implied profit amount and markup percentage. This approach is widely used in retail pricing, wholesale negotiations, and product launch planning because it helps you set a floor price that guarantees a minimum return. If you are comparing margin targets by industry, use a Google search for target profit margin by industry as a starting point, then verify the figures with sources that match your market.
- Use it when planning a new listing or proposal price and you know what margin you need to sustain the business.
- Use it when checking whether a target margin creates an unrealistic selling price compared to competitor offerings.
- Use it when comparing margin and markup, which are often confused but produce very different percentage values.
- Use it to test sensitivity: small changes in the target margin can produce large swings in the required selling price.
Formulas
((Revenue - Cost) / Revenue) x 100
((Revenue - Cost - Fees) / Revenue) x 100
((Revenue - Cost) / Cost) x 100
Cost / (1 - Target Margin / 100)
Margin is revenue-based. Markup is cost-based. A product can have a 40% margin and a much higher markup at the same time. That difference is one reason the comparison chart is useful. Understanding these formulas helps you avoid mispricing and ensures that your profit targets are grounded in the correct mathematical relationship between cost, price, and revenue.
Margin vs Markup comparison table
Many business owners and entrepreneurs confuse margin and markup, which can lead to pricing errors that silently reduce profitability. The table below shows how the same profit amount produces different percentage values depending on which formula you use.
| Selling Price ($) | Cost ($) | Profit ($) | Margin (%) | Markup (%) |
|---|---|---|---|---|
| 100 | 60 | 40 | 40.00% | 66.67% |
| 150 | 90 | 60 | 40.00% | 66.67% |
| 200 | 140 | 60 | 30.00% | 42.86% |
| 80 | 50 | 30 | 37.50% | 60.00% |
| 120 | 70 | 50 | 41.67% | 71.43% |
As the table shows, a 40% margin always corresponds to a markup above 66%, because the denominator is smaller. Always use margin when discussing profitability as a percentage of revenue, and use markup when calculating price increases from cost. Choosing the wrong metric can lead to under-pricing by 20% or more without realizing it.
Fee impact analysis
Fees such as VAT, payment processing charges, platform commissions, and shipping costs can significantly reduce the net profit from each sale. Even a product with a healthy gross margin of 40% can drop to a real margin below 20% after all fee deductions are applied. Understanding how each fee component affects your bottom line is critical for accurate pricing and sustainable profitability.
The table below shows how different fee combinations affect the real margin on a $100 product with a $60 cost (40% gross margin).
| Fee scenario | VAT | Card fee | Platform fee | Shipping | Real margin |
|---|---|---|---|---|---|
| No fees | 0% | 0% | 0% | $0 | 40.00% |
| Low fee marketplace | 0% | 2.5% | 5% | $3 | 29.50% |
| High fee marketplace | 0% | 3.5% | 15% | $5 | 16.50% |
| VAT-inclusive | 10% | 2.5% | 10% | $4 | 13.50% |
| International sale | 20% | 3.0% | 12% | $8 | -3.00% |
This table illustrates why running the fee-adjusted calculation is essential before finalizing any product price. A product that looks profitable on gross margin alone may barely break even after fees in certain sales channels.
Practical applications
E-commerce sellers can assess profitability after marketplace fees, compare categories such as electronics and apparel, and adjust pricing to cover shipping and tax assumptions. Retailers can set prices for new products, analyze bulk product sales, and check the impact of credit card fees. Manufacturers can compare margins across product lines and account for material and shipping costs in pricing decisions. Freelancers and service providers can also use the reverse margin mode to calculate hourly or project rates that guarantee a target profit above direct costs. The table below summarizes common use cases and the recommended calculator mode for each.
| Use case | Business type | Recommended mode | Key inputs to check |
|---|---|---|---|
| New product pricing | Retailer / Manufacturer | Reverse margin | Cost, target margin |
| Marketplace fee review | E-commerce seller | Standard margin | Price, cost, platform fee, shipping |
| Bulk order analysis | Wholesaler | Standard margin | Price, cost, quantity, shipping |
| Category profitability | Multi-category seller | Standard margin | Price, cost, category grouping |
| Service rate setting | Freelancer / Agency | Reverse margin | Cost (time + materials), target margin |
| Price sensitivity test | Any business | Reverse margin | Cost, multiple target margins |
When you need a wider checklist, open a Google search for e-commerce profit margin fees and shipping and compare the items with the fields in this calculator.
Common pitfalls
- Do not confuse VAT and platform fees with product cost. They are separate deductions in this model and mixing them distorts the margin analysis.
- Check quantity carefully. Revenue, cost, shipping, and total fees all change with quantity. A single-unit margin analysis does not always scale linearly to bulk orders.
- Reverse margin targets close to 100% can produce impractical selling prices that are far above market rates. Always sanity-check the result against competitor pricing.
- A healthy standard margin can still turn into a weak or negative real margin after fee deductions. Always run the full fee-adjusted calculation before finalizing a price.
- Unlisted costs such as packaging, returns, storage, advertising, chargebacks, and payment delays may change actual results. Use this calculator as a planning tool, not a replacement for full accounting.
- Overlooking currency conversion fees or cross-border transaction costs when selling internationally can silently erode margin by an additional 1% to 3%.
Tips for maximizing profitability
The table below summarizes actionable strategies to improve your profit margins, organized by area of focus.
| Area | Strategy | Expected impact |
|---|---|---|
| Cost reduction | Negotiate with suppliers, order in bulk, consolidate fulfillment | Direct margin increase of 2-8% |
| Pricing optimization | Use reverse margin to set floor prices, raise prices on high-demand items | 5-15% improvement on profitable items |
| Fee management | Review platform fees quarterly, negotiate card processing rates | 1-3% real margin recovery |
| Category analysis | Identify high-margin categories, cross-subsidize low-margin items | Portfolio margin stabilization |
| Shipping efficiency | Negotiate carrier rates, optimize packaging weight, offer free shipping thresholds | 2-5% cost reduction on fulfillment |
| Periodic audits | Run margin audits quarterly to catch cost creep and fee changes | Prevents 1-4% annual margin erosion |
- Optimize costs by negotiating with suppliers, ordering in bulk, or reducing shipping cost through consolidated fulfillment.
- Use the category field to group products and identify high margin groups that can subsidize lower-margin items in your catalog.
- Test pricing strategies with reverse margin before changing a live listing. A 5% increase in margin can significantly boost net profit without increasing cost.
- Review platform and card fees regularly because they can change without notice and materially reduce real margin over time.
- For complex analyses involving multiple sales channels, inventory carrying costs, or variable overhead, work with financial advisors or accounting software for deeper review.
- Run periodic margin audits on your entire product catalog to catch cost creep, expired supplier contracts, or fee changes that have gone unnoticed.
References
- Wikipedia: Margin (economics) - comprehensive overview of margin concepts in economics and finance.
- Investopedia: Profit Margin - detailed explanation of profit margin types, formulas, and industry benchmarks.