What EBITDA is and why it matters for investment analysis
EBITDA stands for earnings before interest, taxes, depreciation, and amortization. It is a widely used financial metric that approximates operating profitability by stripping out the effects of capital structure, tax jurisdiction, and non-cash accounting charges. Investors, analysts, and business owners rely on EBITDA to compare the core earnings performance of companies across different industries and geographies without the distortion caused by financing decisions or depreciation policies. EBITDA is a cornerstone metric in leveraged buyout analysis, merger and acquisition valuation, and credit underwriting because it focuses attention on the operating earnings power of a business before capital structure decisions and accounting conventions cloud the picture.
For example, two companies in the same sector may have identical operating performance but report very different net income because one uses more debt financing or holds older assets with lower depreciation. EBITDA removes these variables, offering a cleaner view of operational efficiency. A Google search for EBITDA valuation in comparable company analysis can help you see how practitioners apply this metric in real-world equity research and merger models. Understanding EBITDA deeply is essential for anyone involved in financial statement analysis, investment banking, private equity, or corporate finance decision-making.
EBITDA formula and step-by-step calculation
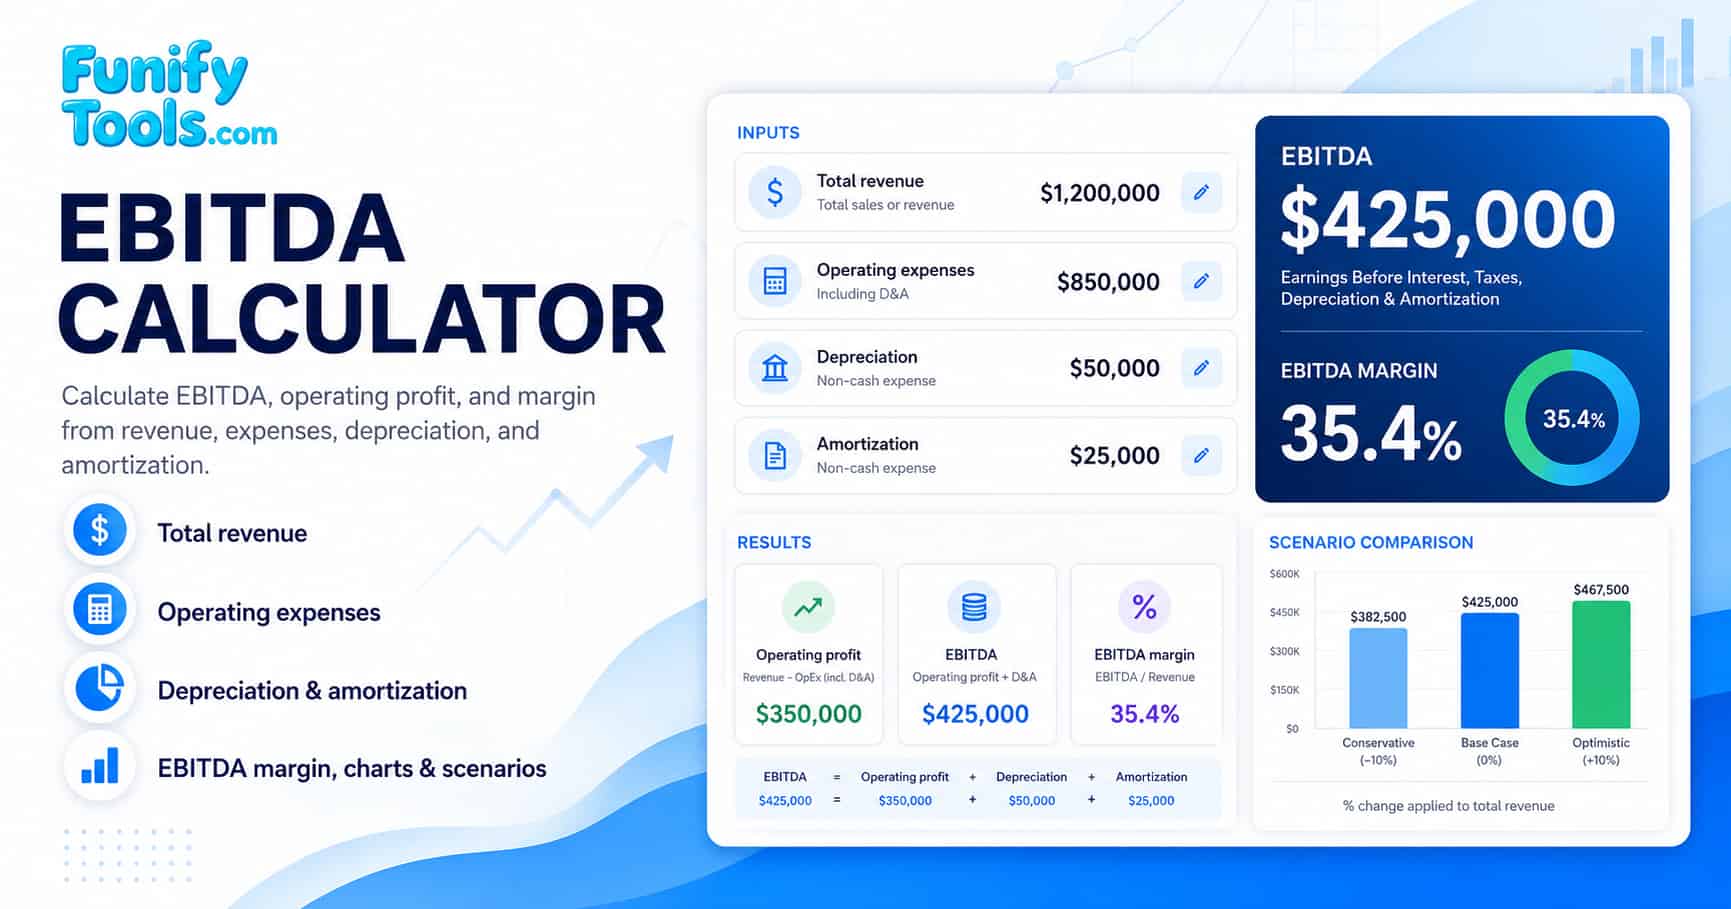
This calculator keeps the EBITDA formula visible so you can check each input against a financial statement line item before comparing scenarios. The calculation follows three straightforward steps derived from a standard income statement. The EBITDA formula is sometimes expressed in expanded form as EBITDA = Net Income + Interest + Taxes + Depreciation + Amortization, but the approach used here starts from operating profit for clarity.
Revenue - Operating expenses
Operating profit + Depreciation + Amortization
EBITDA ÷ Revenue × 100
Because this calculator starts from operating profit, use operating expenses that include depreciation and amortization. If your operating expenses exclude D&A, either include those D&A amounts in operating expenses first or use EBITDA = Revenue - cash operating expenses. For broader background, you can compare public examples with a Google search for EBITDA vs operating income to see how the two metrics differ in practice. The formula section above is designed to be directly comparable to the line items on a standard income statement, making it easy to transfer numbers from your financial reports without manual adjustments.
How to interpret EBITDA and EBITDA margin
EBITDA is most useful when it is compared with similar businesses, the same company across multiple periods, or management guidance that explains the underlying adjustments. A Google search for EBITDA margin by industry provides a useful starting point for market context, but always verify benchmarks against primary company filings such as 10-K or annual reports. The table below shows representative EBITDA margin ranges across selected sectors to illustrate how capital intensity and competitive dynamics influence operating profitability.
| Industry sector | Typical EBITDA margin range | Key drivers |
|---|---|---|
| Software & cloud services | 25% - 45% | High gross margins, scalable delivery, low capital intensity |
| Healthcare & pharmaceuticals | 20% - 35% | Patent protection, R&D investment, regulatory barriers |
| Industrial manufacturing | 10% - 20% | Capital equipment costs, supply chain complexity, raw material volatility |
| Retail & consumer goods | 5% - 15% | Thin margins driven by competition, inventory turnover, and labor costs |
| Energy & utilities | 15% - 30% | Commodity price cycles, regulatory frameworks, large infrastructure assets |
- Positive EBITDA indicates that the selected period produced operating earnings before depreciation and amortization adjustments, suggesting the business covers its core operating costs from revenue.
- EBITDA margin expresses EBITDA as a percentage of revenue. A higher margin can suggest stronger operating efficiency, but comparisons are most meaningful within the same industry because capital intensity and cost structures vary widely across sectors.
- Trend analysis over several reporting periods is often more informative than a single-period snapshot. A rising EBITDA margin over consecutive quarters may signal improving cost control or pricing power, while a declining trend could indicate margin pressure from rising input costs or competitive pricing.
- Absolute EBITDA alone does not reveal the quality of earnings. Always consider revenue growth, working capital requirements, and capital expenditure needs alongside EBITDA to build a complete picture of financial health and sustainability.
Adjusted EBITDA and common adjustments
Many publicly traded companies report Adjusted EBITDA, which modifies the standard EBITDA calculation by removing certain items that management considers non-recurring, non-operating, or otherwise not reflective of ongoing business performance. Adjustments vary significantly across companies and industries, so it is essential to review the reconciliation notes in financial reports when comparing Adjusted EBITDA across different businesses. A Google search for Adjusted EBITDA reconciliation examples can help you recognize common disclosure formats before checking the actual filing. The Securities and Exchange Commission (SEC) and other regulators closely monitor how companies present non-GAAP measures like Adjusted EBITDA, and companies must provide a reconciliation to the most directly comparable GAAP measure.
| Adjustment area | Example | Why it matters |
|---|---|---|
| Restructuring | Facility closure, layoffs, reorganization costs | May be treated as non-recurring by a company |
| Legal or settlement items | Litigation settlement or unusual claim | Can distort a single-period comparison |
| Stock-based compensation | Share-based compensation expense | Common adjustment in some technology companies |
| Acquisition costs | Integration cost or acquired intangible amortization | May not represent normal operating activity |
EBITDA vs other financial metrics: a comparison table
Understanding how EBITDA relates to other common profitability and cash flow metrics helps you choose the right tool for each analysis scenario. The table below summarizes the key differences between five widely used financial metrics.
| Metric | What it measures | Includes D&A | Includes interest & taxes | Best used for |
|---|---|---|---|---|
| EBITDA | Operating earnings before non-cash charges | No (added back) | No | Cross-company operating comparison, valuation multiples |
| Operating profit (EBIT) | Profit from core operations | Yes (deducted) | No | Core business profitability after operating costs |
| Net income | Bottom-line profit after all expenses | Yes (deducted) | Yes | Total shareholder earnings including financing effects |
| Free cash flow | Cash available after capex and working capital | No (non-cash) | Yes (deducted) | Liquidity analysis, dividend capacity, reinvestment needs |
| Gross profit | Revenue minus cost of goods sold | Depends on COGS | No | Product-level margin analysis before operating expenses |
Each metric serves a distinct purpose. EBITDA is not a substitute for cash flow analysis or net income evaluation. Use the table above as a quick reference when deciding which figure to highlight in your investment memo or business review.
EBITDA valuation multiples: how enterprise value relates to EBITDA
One of the most common applications of EBITDA in corporate finance is the EV/EBITDA multiple, which compares a company's enterprise value to its EBITDA. This multiple is widely used in comparable company analysis and precedent transaction analysis because it neutralizes the effects of capital structure, tax rates, and depreciation policies across different companies. A lower EV/EBITDA multiple relative to peers may suggest the company is undervalued, while a higher multiple may indicate a premium valuation or expected future growth.
| EV/EBITDA range | Typical interpretation | Common context |
|---|---|---|
| Below 5x | Low valuation multiple | Cyclical industries, distressed companies, or small-cap value stocks |
| 5x - 10x | Moderate valuation multiple | Industrial, retail, and many mature manufacturing businesses |
| 10x - 15x | Above-average valuation multiple | Healthcare, technology, and high-growth service companies |
| Above 15x | High valuation multiple | Fast-growing software, biotech, or premium brand companies |
The EV/EBITDA multiple is especially popular in leveraged buyout (LBO) modeling because it provides a quick approximation of how many years of EBITDA would be needed to repay the acquisition debt. However, like all valuation multiples, it should be used alongside other metrics such as price-to-earnings ratio, price-to-book ratio, and discounted cash flow analysis for a comprehensive investment assessment.
Limitations of EBITDA every analyst should know
While EBITDA is a popular shorthand for operating performance, it has several important limitations that can mislead investors who rely on it exclusively. A thorough understanding of these shortcomings is essential for responsible financial analysis and investment decision-making.
- EBITDA is not cash flow. It does not account for working capital changes, capital expenditures, debt repayments, or lease obligations. A company with positive EBITDA can still face a cash crunch if it requires heavy capital investment or has unfavorable payment terms with customers.
- Two companies can report similar EBITDA but have very different reinvestment needs, risk profiles, and capital structures. Always examine the full balance sheet and cash flow statement alongside EBITDA.
- Accounting policy differences and adjustment definitions can reduce comparability. For example, one company may classify certain expenses as cost of goods sold while another reports them as operating expenses, altering the EBITDA calculation.
- Debt service, interest rates, tax obligations, and lease structures can still be critical even when EBITDA looks strong. A highly leveraged company with robust EBITDA may still struggle to meet its interest payments in a rising-rate environment.
- Growth companies and startups often report negative EBITDA during their expansion phase. A negative EBITDA is not automatically a red flag, but it warrants deeper investigation into the company's path to profitability and burn rate.
Example scenarios using the EBITDA calculator
The following examples illustrate how changes in inputs affect EBITDA and EBITDA margin. You can replicate these scenarios directly in the calculator above to build practical intuition about how operating leverage and cost structure influence the final result.
Scenario A - Healthy operating margin: Total revenue is 1,000,000 dollars, operating expenses including D&A are 650,000 dollars, depreciation is 50,000 dollars, and amortization is 25,000 dollars. Operating profit is 350,000 dollars. EBITDA is 425,000 dollars, and EBITDA margin is 42.5 percent. This scenario represents a company with strong cost control and moderate capital asset intensity.
Scenario B - Higher operating expenses: If operating expenses including D&A rise to 750,000 dollars with the other inputs unchanged, operating profit falls to 250,000 dollars, EBITDA falls to 325,000 dollars, and the EBITDA margin drops to 32.5 percent. The scenario comparison feature in this calculator helps you see this sensitivity instantly without manually re-entering all fields.
Scenario C - Low-margin, high-volume business: Revenue is 2,000,000 dollars, operating expenses including D&A are 1,800,000 dollars, depreciation is 30,000 dollars, and amortization is 10,000 dollars. Operating profit is 200,000 dollars. EBITDA is 240,000 dollars, and EBITDA margin is only 12 percent. This illustrates how businesses with thin operating margins can still generate meaningful absolute EBITDA through scale.
Use the Compare scenarios section below the calculator to save multiple input sets side by side. This is especially helpful when evaluating different budget assumptions, acquisition targets, or year-over-year performance changes. The scenario comparison tool can keep up to four different input sets and display them in a side-by-side table for quick visual comparison.
References and further reading
Wikipedia: EBITDA | SEC EDGAR company filings | Investopedia: EBITDA