Book Value Per Share calculator guide
The Book Value Per Share (BPS) calculator estimates the accounting equity value assigned to each outstanding common share using balance sheet data. It is useful when you want a quick balance sheet view from total assets, total liabilities, and the current share count. BPS is widely used by value investors and analysts to assess whether a stock is trading below its net asset value. Understanding BPS helps investors evaluate the financial foundation of a company and make more informed decisions about stock purchases, portfolio allocation, and risk assessment.
BPS is also written as BVPS (Book Value Per Share). Investors often compare it with market price, PBR (Price-to-Book Ratio), ROE (Return on Equity), earnings, and cash flow to build a more complete picture of a company's financial health. For real-world examples of how BPS is applied across different sectors, you can search Google for book value per share examples by industry and compare how different companies report the inputs on their balance sheets. The BPS metric becomes particularly meaningful when tracked over multiple quarters, as it reveals whether management is building or eroding shareholder equity over time.
Formula
BPS represents the net asset value attributable to each outstanding common share under book accounting values. This calculator uses the following formula:
Total assets - Total liabilities
Total equity / Outstanding shares
Market price per share / BPS
These formulas are the foundation of book value analysis. Understanding each component helps you interpret the result more accurately and avoid common misapplications of the metric. The relationship between total assets, total liabilities, and outstanding shares determines the final BPS figure, so each input must be verified for accuracy before drawing investment conclusions.
| Formula component | Directional change | Impact on BPS | Real-world scenario |
|---|---|---|---|
| Total assets increase | Up | BPS increases (if liabilities unchanged) | Company acquires new equipment or generates higher cash reserves |
| Total liabilities increase | Up | BPS decreases (if assets unchanged) | Company takes on new debt to fund operations or acquisitions |
| Outstanding shares increase | Up | BPS decreases (dilution effect) | Company issues new shares through a secondary offering or stock-based compensation |
| Share buyback program | Shares down | BPS increases mechanically | Company repurchases shares, reducing the denominator without changing equity |
| Net profit retained | Equity up | BPS increases over time | Company earns profit and retains it instead of distributing as dividends |
| Dividend payment | Equity down | BPS decreases slightly | Company pays cash dividends, reducing retained earnings and total equity |
Where to find the inputs
Total assets and total liabilities usually come from the balance sheet (also called the statement of financial position). Outstanding shares may appear in the equity note, cover page, annual report (10-K), quarterly report (10-Q), or investor relations data. Use the same reporting date for all inputs when possible to ensure consistency in your calculation. Many financial data platforms such as Yahoo Finance, Bloomberg, and Morningstar provide this information, but always cross-reference with the company's official filings for the most reliable figures.
If the share count is hard to locate, you can search Google for outstanding shares on financial statements and then confirm the value against the company's official filing. Always prefer primary sources such as SEC filings or the company's investor relations page over third-party aggregators. For companies listed on international exchanges, check the local regulatory filing database for the most authoritative share count data.
| Input | Typical source | Check before using |
|---|---|---|
| Total assets | Balance sheet | Use consolidated assets when analyzing the whole company. |
| Total liabilities | Balance sheet | Include current and non-current liabilities. |
| Outstanding shares | Equity note, filing cover page, or investor data | Use common shares outstanding and avoid treasury shares when possible. |
BPS vs Book Value: Understanding the difference
Many investors confuse Book Value Per Share (BPS) with total Book Value (total equity). While they are related, they serve different analytical purposes. Total Book Value represents the entire shareholders' equity on the balance sheet, while BPS divides that equity by the number of outstanding shares to show the per-share value. BPS is more useful for comparing companies of different sizes because it normalizes the equity figure on a per-share basis. Total Book Value is better suited for understanding the absolute scale of a company's net worth. Both metrics are essential for a complete valuation analysis, and investors should examine them alongside market capitalization and enterprise value for a comprehensive view.
| Metric | Full name | What it measures | Source statement | Typical use case |
|---|---|---|---|---|
| BPS / BVPS | Book Value Per Share | Net asset value per share under accounting rules | Balance sheet | Assess whether a stock is undervalued relative to its net assets |
| EPS | Earnings Per Share | Net profit allocated to each outstanding share | Income statement | Measure profitability and compare earnings across companies |
| CFPS | Cash Flow Per Share | Operating cash flow per outstanding share | Cash flow statement | Evaluate cash generation ability independent of accounting adjustments |
| DPS | Dividends Per Share | Total dividends paid per outstanding share | Cash flow statement or retained earnings | Assess income potential and dividend sustainability |
| Revenue PS | Revenue Per Share | Total revenue divided by outstanding shares | Income statement | Compare top-line performance normalized by share count |
BPS vs market metrics
BPS is an accounting measure based on historical cost. Market price is what investors currently pay for one share in the open market. PBR connects the two by dividing market price by BPS. A low PBR can look attractive, but it may also reflect weak profitability, asset quality concerns, or industry pressure. Conversely, a high PBR may indicate strong earnings power or intangible assets not captured on the balance sheet. The PBR ratio is most meaningful when analyzed within the same industry, as different sectors have vastly different asset structures and accounting conventions.
For deeper comparison ideas, you can search Google for BPS vs price-to-book ratio comparison and examine how analysts combine these two metrics with earnings trends and cash flow statements to reach a more informed valuation opinion. Many value investors use the Graham Number, which combines BPS and EPS to estimate a stock's maximum fair price, as a practical application of book value analysis.
Typical Book Value Per Share patterns
BPS varies widely by industry, accounting policy, asset structure, leverage, and company size. The examples below are broad educational patterns rather than valuation rules. Always compare BPS within the same industry group for a more meaningful analysis. Investors should also consider the age and composition of assets, as older assets may be significantly depreciated and understate the true replacement value of the company's productive capacity.
| Company type | Common pattern | How to read BPS |
|---|---|---|
| Technology companies | Reported book value can be lower because internally developed intangible value may not appear fully on the balance sheet. | Compare with earnings growth, cash flow, and retained capital. |
| Manufacturing companies | Physical assets, inventory, and equipment may make book value more visible in accounting records. | Check asset age, depreciation, inventory quality, and debt. |
| Financial institutions | Book value can be central because assets and liabilities are financial in nature. | Review leverage, capital ratios, reserves, and asset quality. |
Limitations of Book Value Per Share
While BPS is a useful starting point for evaluating a company's net asset position, it has several important limitations that investors should understand before relying on it for investment decisions. The following table summarizes the key drawbacks and how they affect your analysis:
| Limitation | Explanation | How it affects BPS |
|---|---|---|
| Historical cost accounting | Assets are recorded at their original purchase price minus depreciation, not at current market value. | BPS may understate or overstate the true economic value of assets like real estate or outdated equipment. |
| Intangible assets omission | Internally developed brands, patents, and intellectual property are generally not recorded on the balance sheet. | BPS can significantly underestimate the value of knowledge-intensive companies, especially in technology and pharmaceutical sectors. |
| Share buyback impact | Companies that aggressively repurchase shares can reduce outstanding shares and mechanically increase BPS without improving underlying operations. | A rising BPS may reflect financial engineering rather than genuine value creation. Always check the share count trend. |
| Industry comparability | Different industries follow different asset structures and accounting conventions, making cross-industry BPS comparisons misleading. | Compare BPS and PBR only within the same industry group to avoid drawing incorrect conclusions about relative value. |
These limitations highlight why BPS should never be used in isolation. Combining BPS with earnings quality analysis, cash flow trends, management effectiveness, and industry benchmarks provides a more robust framework for investment research. For a deeper understanding of how accounting standards affect reported book values, you can search Google for limitations of book value per share under different accounting standards and explore how IFRS versus GAAP treatment can lead to significantly different BPS figures for the same company.
Worked example
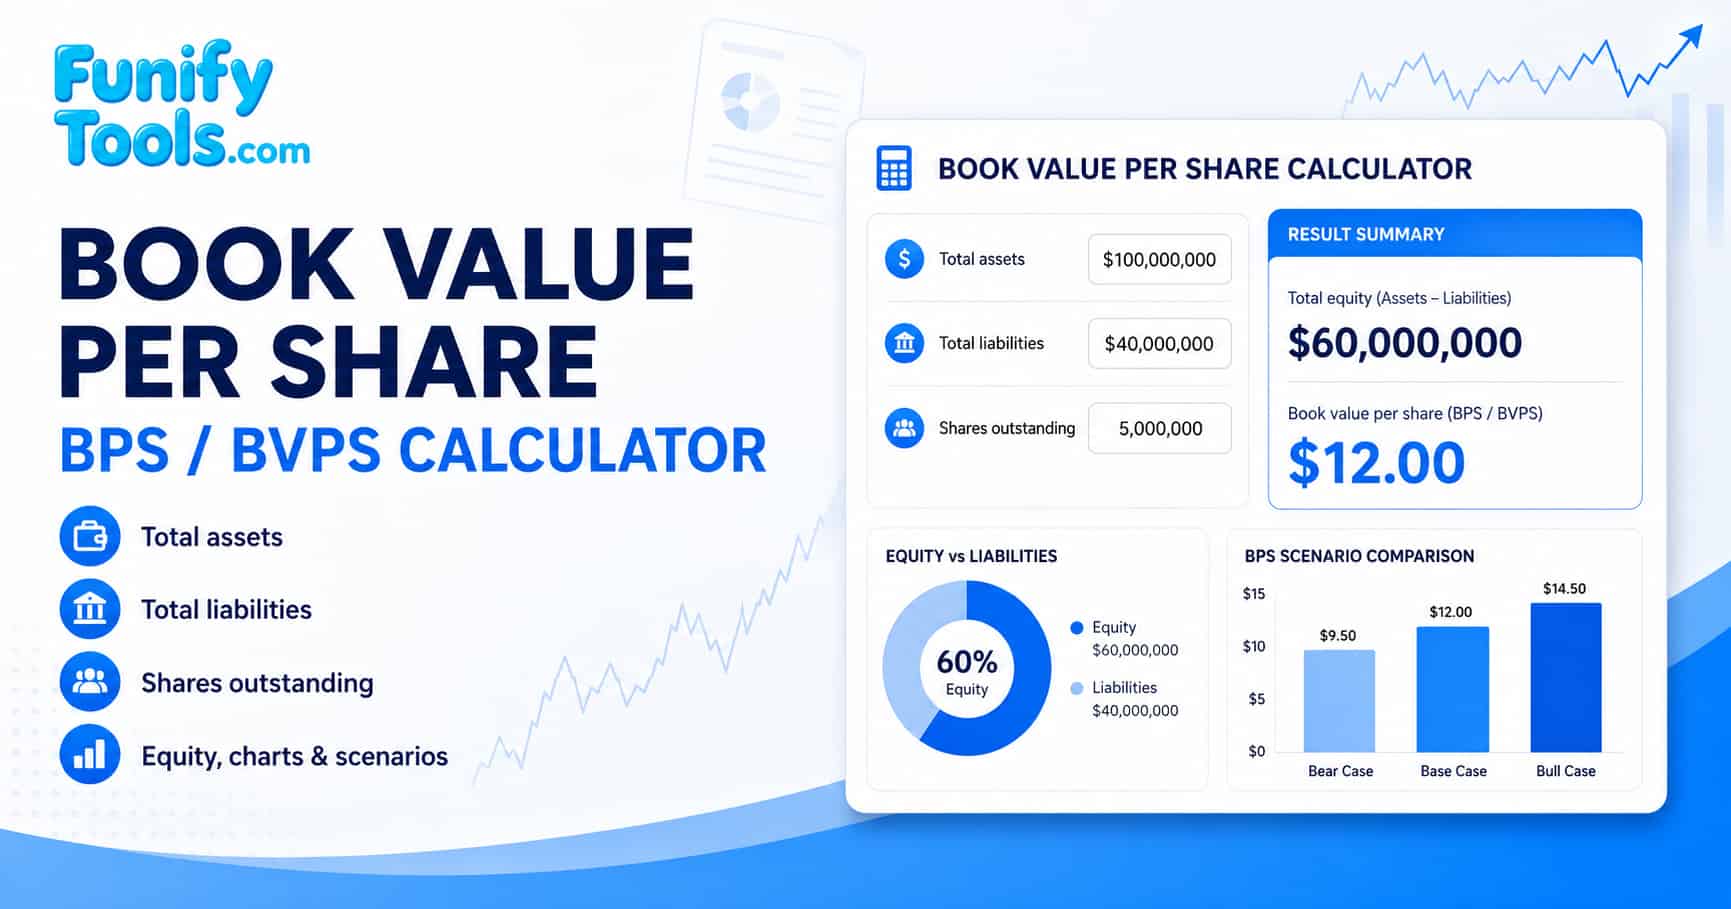
Assume a company reports 100,000,000 in total assets, 40,000,000 in total liabilities, and 5,000,000 outstanding shares. Total equity is 60,000,000. Dividing 60,000,000 by 5,000,000 shares gives a BPS of 12.00 per share.
If the market price is 18.00, the implied PBR is 1.5. That does not automatically mean the stock is expensive or cheap. The interpretation depends on profitability, asset quality, growth, risk, and the industry comparison group. For example, a PBR of 1.5 might be reasonable for a profitable manufacturing company with modern equipment, but expensive for a financial institution with high leverage and low returns on equity.
| Scenario | Total assets | Total liabilities | Outstanding shares | Total equity | BPS | Market price | PBR |
|---|---|---|---|---|---|---|---|
| Base case | 100,000,000 | 40,000,000 | 5,000,000 | 60,000,000 | 12.00 | 18.00 | 1.50 |
| High leverage | 100,000,000 | 70,000,000 | 5,000,000 | 30,000,000 | 6.00 | 18.00 | 3.00 |
| Low leverage | 100,000,000 | 20,000,000 | 5,000,000 | 80,000,000 | 16.00 | 18.00 | 1.13 |
| Share dilution | 100,000,000 | 40,000,000 | 8,000,000 | 60,000,000 | 7.50 | 18.00 | 2.40 |
| Negative equity | 80,000,000 | 100,000,000 | 5,000,000 | -20,000,000 | -4.00 | 18.00 | N/A |
| Asset growth | 150,000,000 | 60,000,000 | 5,000,000 | 90,000,000 | 18.00 | 18.00 | 1.00 |
How to interpret BPS
A higher BPS can indicate a larger amount of accounting equity per share, but it is not automatically a sign that a stock is cheap or safe. Compare BPS with market price, PBR, earnings per share (EPS), return on equity (ROE), cash flow, and industry norms to form a more complete assessment. The trend of BPS over multiple reporting periods is often more informative than a single snapshot, as it reveals whether the company is consistently building shareholder value.
If BPS is negative, total liabilities exceed total assets. This can be a warning sign, but the meaning depends on the business model, accounting treatment, restructuring plans, and current market expectations. Some companies operate successfully with negative book value for extended periods if they generate strong and consistent cash flows. For example, many technology and service companies operate with minimal tangible assets while generating substantial free cash flow, making negative BPS less concerning than it would be for capital-intensive industries.
- Use accurate and up-to-date financial data from company reports or official filings.
- Use the same reporting period for assets, liabilities, and share count to avoid mismatched inputs.
- Compare BPS with earnings, cash flow, ROE, PBR, debt levels, and industry norms.
- Cross-check the share count trend: a declining count may inflate BPS without real value creation.
- Consult a qualified financial professional for detailed investment analysis tailored to your specific situation.
References
Wikipedia: Book value | Wikipedia: Shareholders' equity | Wikipedia: Price-to-book ratio