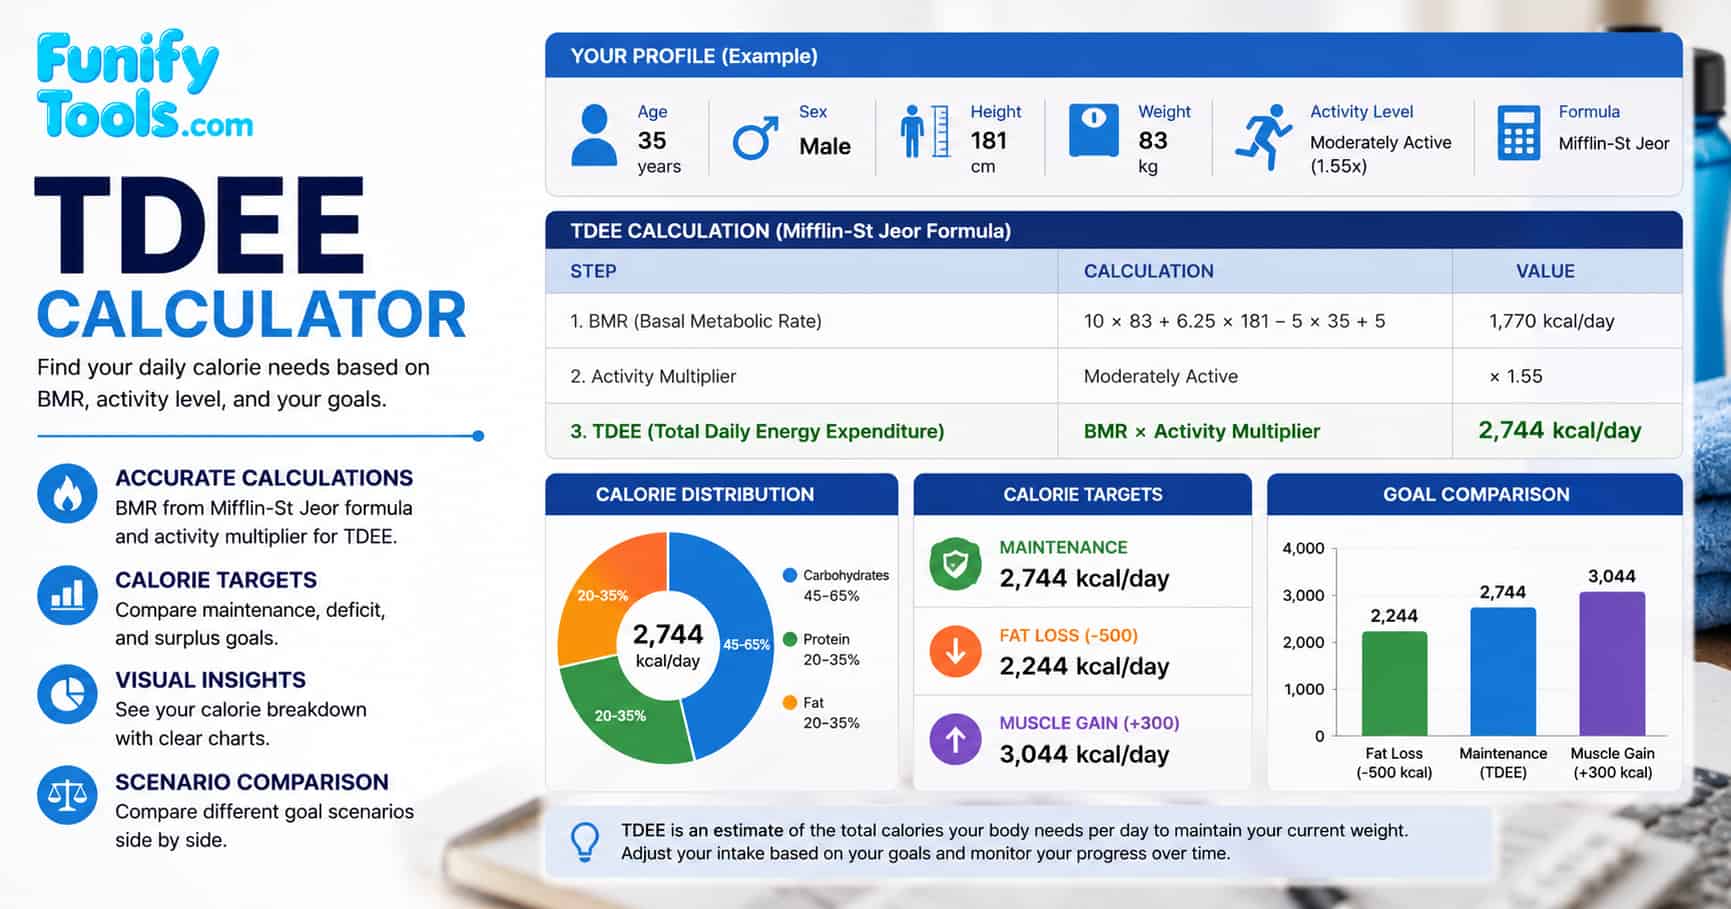
What TDEE is and why it matters
Total Daily Energy Expenditure (TDEE) represents the total number of calories your body burns over a 24-hour period. It is the sum of your Basal Metabolic Rate (BMR), the thermic effect of food (TEF), non-exercise activity thermogenesis (NEAT), and the calories burned through planned exercise. Most online calculators, including this one, use a simplified but practical model: TDEE = BMR x activity factor.
Understanding your TDEE is essential for any weight management goal. If you consume roughly the same number of calories as your TDEE, your weight is likely to remain stable. Eating below TDEE creates a calorie deficit that supports fat loss, while eating above TDEE creates a surplus that supports muscle and weight gain. Because individual factors such as genetics, sleep quality, and hormonal fluctuations can shift real energy expenditure, the TDEE figure should be treated as a starting estimate rather than an exact measurement.
For a deeper scientific overview of how the human body expends energy, you can refer to the NCBI resource on energy balance and body weight regulation, which explains the physiological mechanisms behind calorie burn and weight change. If you are curious about how the concept of calorie burn applies to everyday activities, a Google search on daily calorie burn and TDEE can help you find additional resources and community discussions on the topic.
BMR formulas used here
This calculator supports three well-established BMR equations. Each equation estimates resting energy expenditure using weight, height, age, and biological sex. After computing BMR, TDEE is calculated by multiplying BMR by your selected activity factor.
| Formula | Male equation | Female equation |
|---|---|---|
| Mifflin-St Jeor | 10W + 6.25H - 5A + 5 | 10W + 6.25H - 5A - 161 |
| Harris-Benedict Original | 66.473 + 13.7516W + 5.0033H - 6.755A | 655.0955 + 9.5634W + 1.8496H - 4.6756A |
| Harris-Benedict Revised | 88.362 + 13.397W + 4.799H - 5.677A | 447.593 + 9.247W + 3.098H - 4.330A |
In the equations, W is weight in kilograms, H is height in centimeters, and A is age in years. The Mifflin-St Jeor equation, published in 1990, is widely regarded as the most accurate for the general population. The original Harris-Benedict equation dates back to 1919 and tends to overestimate BMR in modern populations, while the revised version (1984) updated the coefficients for better accuracy. For additional context on how these equations were developed and validated, the Mifflin-St Jeor study on PubMed provides the original research data.
Activity factors explained
Pick the option that best matches your typical weekly routine:
- Sedentary, little or no exercise: factor 1.2
- Lightly active, light exercise 1 to 3 days per week: factor 1.375
- Moderately active, moderate exercise 3 to 5 days per week: factor 1.55
- Very active, hard exercise 6 to 7 days per week: factor 1.725
- Extra active, very hard exercise plus physical job: factor 1.9
If you are unsure which category fits, choose a lower factor first and adjust based on real weight trends over a few weeks. Many people overestimate their activity level, which leads to an inflated TDEE and slower-than-expected progress. Tracking your steps with a pedometer or fitness tracker can give you a more objective picture of your daily movement patterns.
Using TDEE for weight goals
Maintenance
Consuming roughly the same number of calories as your estimated TDEE should keep your weight stable over time, assuming your daily routine and activity level remain consistent. For most people, maintenance calories serve as the baseline reference point when planning either a weight loss or weight gain phase.
Weight loss
A calorie deficit below TDEE is the foundation of most fat loss plans. This page shows common deficit targets of 250, 500, and 1000 kcal per day below your TDEE. A 500 kcal daily deficit typically yields about 0.5 kg (1 lb) of fat loss per week, though individual results vary based on metabolism and adherence. Combining a moderate deficit with adequate protein intake and resistance training can help preserve lean muscle mass during the fat loss process.
Weight gain
A calorie surplus above TDEE supports muscle growth and weight gain. This page shows common surplus targets of 250, 500, and 1000 kcal per day above your TDEE. For lean muscle gain, a moderate surplus of 250 to 500 kcal per day combined with resistance training is often recommended to minimize fat accumulation. Athletes and individuals engaged in regular strength training may benefit from a more carefully calibrated surplus that aligns with their training volume and recovery needs.
The goal table is a planning aid, not a prescription. The most effective target is the one you can follow consistently while tracking your weight trends and adjusting as needed. For more detailed information on how calorie balance affects body composition, a Google search on calorie deficit recommendations can provide additional guidance from nutrition experts and health organizations.
Example TDEE values by activity level
The table below illustrates how TDEE changes across activity levels for a reference individual. These figures use the Mifflin-St Jeor BMR formula, rounded to the nearest whole calorie, and are provided as an example only - your actual TDEE will depend on your personal body stats.
| Activity level | Activity factor | BMR (kcal/day) | TDEE (kcal/day) |
|---|---|---|---|
| Sedentary | 1.2 | 1,791 | 2,150 |
| Lightly active | 1.375 | 1,791 | 2,463 |
| Moderately active | 1.55 | 1,791 | 2,776 |
| Very active | 1.725 | 1,791 | 3,090 |
| Extra active | 1.9 | 1,791 | 3,403 |
As the table shows, the difference between a sedentary lifestyle and a very active routine can exceed 900 kcal per day for the same individual. This highlights why selecting the right activity factor is one of the most important steps in getting a useful TDEE estimate. If your daily routine includes both a desk job and regular workouts, the "Moderately active" or "Very active" category may be the most appropriate starting point.
Calorie deficit comparison across activity levels
The table below shows how the same 500 kcal daily deficit produces different target calorie intakes depending on your activity level. This comparison helps illustrate why two people of the same height and weight may need different deficit targets to achieve similar weekly fat loss rates. All values are calculated using the Mifflin-St Jeor BMR formula for a 35-year-old male, 181 cm, 83 kg.
| Activity level | TDEE (kcal/day) | Deficit -250 kcal | Deficit -500 kcal | Deficit -1000 kcal |
|---|---|---|---|---|
| Sedentary | 2,150 | 1,900 | 1,650 | 1,150 |
| Lightly active | 2,463 | 2,213 | 1,963 | 1,463 |
| Moderately active | 2,776 | 2,526 | 2,276 | 1,776 |
| Very active | 3,090 | 2,840 | 2,590 | 2,090 |
| Extra active | 3,403 | 3,153 | 2,903 | 2,403 |
Notice that a sedentary individual on a 500 kcal deficit would consume about 1,650 kcal per day, while an extra active person on the same deficit would still consume about 2,903 kcal per day. This wide variation underscores why personalized TDEE calculation is important. A deficit that is too aggressive for a sedentary person may lead to excessive hunger, nutrient insufficiency, and metabolic slowdown, while the same deficit may be perfectly manageable for someone with a higher activity level.
BMR comparison by gender, age, and weight
The table below compares how BMR changes across different age groups and body weights for both males and females using the Mifflin-St Jeor formula. Height is fixed at 175 cm for males and 163 cm for females to represent average adult statures. This table helps illustrate why age and body composition adjustments are important when estimating daily energy needs.
| Gender | Age (years) | Weight (kg) | Height (cm) | BMR (kcal/day) |
|---|---|---|---|---|
| Male | 25 | 70 | 175 | 1,674 |
| Male | 25 | 85 | 175 | 1,824 |
| Male | 45 | 70 | 175 | 1,574 |
| Male | 45 | 85 | 175 | 1,724 |
| Female | 25 | 55 | 163 | 1,283 |
| Female | 25 | 70 | 163 | 1,433 |
| Female | 45 | 55 | 163 | 1,183 |
| Female | 45 | 70 | 163 | 1,333 |
Several important patterns emerge from this comparison. First, BMR decreases with age for both genders due to natural declines in lean muscle mass and metabolic activity. Second, heavier individuals generally have higher BMR values because more body mass requires more energy to maintain. Third, males tend to have higher BMR than females of similar age and weight, primarily due to differences in average body composition and muscle mass. Understanding these patterns can help you interpret your own TDEE results more accurately and set realistic expectations for your weight management journey.
Limitations and accuracy
TDEE is an estimate and can differ meaningfully from real outcomes. Understanding these limitations helps you use the calculator more effectively.
Daily movement varies a lot
Non-exercise activity thermogenesis (NEAT) - the calories burned through walking, standing, fidgeting, household chores, and job demands - can vary by several hundred calories per day between two people with the same height and weight. This is one of the largest sources of error in TDEE estimation.
Body composition matters
More lean body mass generally increases resting energy needs. Two individuals of the same age, height, and weight can have very different body compositions, yet formulas based only on height, weight, age, and sex cannot account for this difference. An athlete with higher muscle mass may have a BMR that is 200 to 400 kcal higher than someone with a higher body fat percentage at the same body weight.
Metabolic adaptation can occur
During prolonged calorie restriction, the body may reduce its energy expenditure as a compensatory response - a phenomenon known as metabolic adaptation. This can slow weight loss over time. Use this calculator as a starting point, then validate your numbers by tracking your weight trends for at least two to three weeks and adjusting your calorie intake accordingly. If you experience a prolonged plateau despite consistent adherence, it may be worth revisiting your TDEE estimate with updated body weight data.
For a broader discussion of how physical activity affects overall health and calorie balance, the World Health Organization fact sheet on physical activity offers evidence-based guidelines and recommendations. Additionally, a Google search comparing BMR formulas can help you explore the nuances between different estimation methods used by health professionals and researchers.