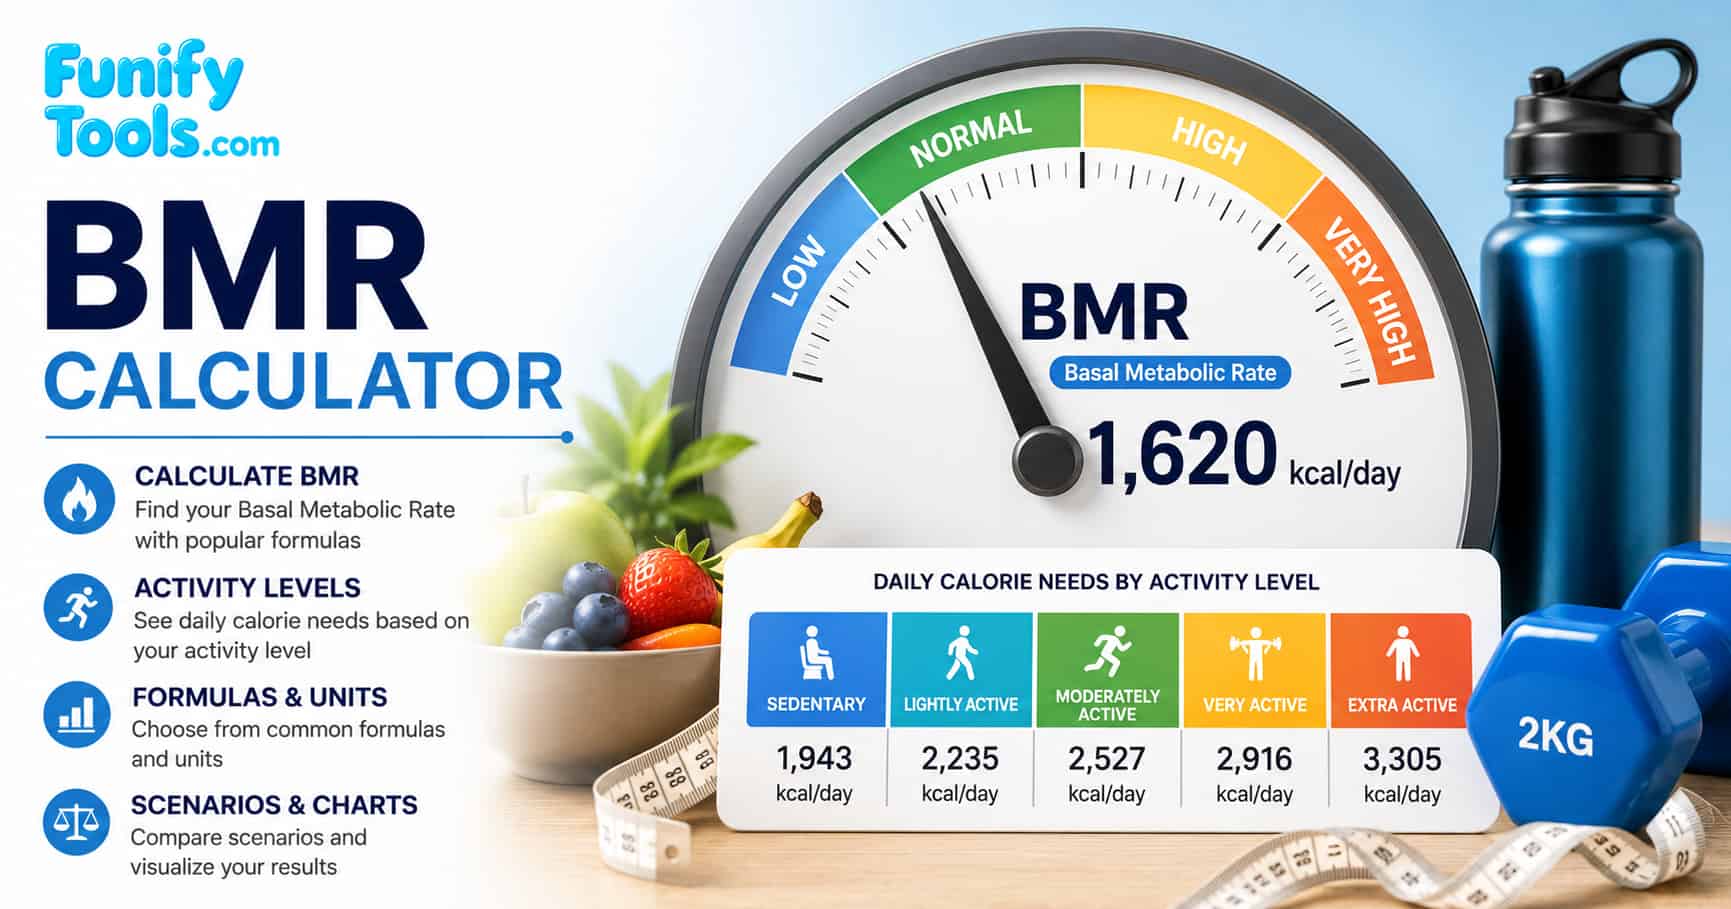
Understanding BMR
BMR, or Basal Metabolic Rate, represents the minimum number of calories your body needs to maintain essential physiological functions such as breathing, circulation, temperature regulation, hormone production, and cell repair while at complete rest. It accounts for approximately 60 to 75 percent of total daily energy expenditure in most individuals, making it the single largest component of your calorie budget. Understanding your BMR is the first step toward building a sustainable nutrition and fitness plan because it establishes the baseline from which all other calorie targets are derived.
For broader context, search for basal metabolic rate vs resting metabolic rate and compare how BMR, RMR, and TDEE are used in nutrition planning. BMR is usually the lowest baseline, while real daily calorie needs increase with movement, training, digestion, and daily routines. The difference between BMR and actual maintenance calories can range from 200 to over 1000 calories per day depending on your activity level. To explore how BMR interacts with overall energy balance, you can search for total daily energy expenditure components BMR NEAT TEF and learn how thermic effect of food and non-exercise activity contribute to your total burn.
BMR formulas
Different formulas exist because no single equation perfectly describes every body. This calculator includes Mifflin-St Jeor, original Harris-Benedict, revised Harris-Benedict, and Katch-McArdle so you can compare assumptions. Each formula was developed using different population samples, which is why results can vary by 50 to 200 calories or more for the same person. The Mifflin-St Jeor equation, published in 1990, is currently the most widely recommended by dietetics professionals because it was validated against modern calorimetry data. If you are curious about the scientific background of these equations, search for the history of BMR formulas Mifflin Harris Benedict development to see how each was derived and validated.
10 * W + 6.25 * H - 5 * A + 5
10 * W + 6.25 * H - 5 * A - 161
370 + 21.6 * Lean body mass kg
BMR * Activity factor
In these formulas, W is weight in kilograms, H is height in centimeters, and A is age in years. Katch-McArdle estimates lean body mass from body fat percentage, so it can be useful when you have a reasonably accurate body composition estimate. Because it uses lean mass directly, Katch-McArdle often produces the most individualized result for people who know their body fat percentage within a few points.
| Formula | Best use | Watch out for |
|---|---|---|
| Mifflin-St Jeor | General adult calorie planning with height, weight, age, and sex. | Still an estimate; does not see muscle mass directly. |
| Original Harris-Benedict | Historical comparison with older calorie calculators. | Can run higher for some modern populations. |
| Revised Harris-Benedict | Alternative estimate using updated coefficients. | May differ from Mifflin by enough to affect a diet target. |
| Katch-McArdle | People with a credible body fat estimate or known lean mass. | Body fat input errors directly distort the result. |
Factors affecting BMR
- Body composition: more muscle mass generally increases BMR because muscle tissue is metabolically more active than fat tissue at rest. A person with higher lean mass can have a BMR that is 100 to 300 calories higher than someone of the same weight with higher body fat.
- Age: BMR often decreases with age, typically by about 1 to 2 percent per decade after early adulthood. This decline is partly due to gradual muscle loss, which is why strength training becomes increasingly important for metabolic health as you get older.
- Sex used by formula: equations differ because the selected BMR equation uses sex-specific coefficients. Men tend to have higher lean mass on average, which results in a higher BMR compared to women of the same age, height, and weight.
- Other: genetics, hormones, pregnancy, lactation, and environmental temperature can influence energy use. Certain medical conditions such as thyroid disorders can also shift BMR significantly, which is why a calculator result should always be treated as an estimate rather than a precise measurement.
If you are comparing formula choices, search for Mifflin St Jeor vs Harris Benedict BMR equation and look for discussion about which equation best matches your use case. General calorie planning often starts with Mifflin-St Jeor, while body-composition-focused planning may compare Katch-McArdle.
| Weight (kg) | Weight (lb) | Male BMR (kcal/day) | Female BMR (kcal/day) |
|---|---|---|---|
| 55 | 121 | 1,499 | 1,333 |
| 65 | 143 | 1,599 | 1,433 |
| 75 | 165 | 1,699 | 1,533 |
| 85 | 187 | 1,799 | 1,633 |
| 95 | 209 | 1,899 | 1,733 |
| 105 | 231 | 1,999 | 1,833 |
Activity level multipliers
To estimate daily calories, often called TDEE or Total Daily Energy Expenditure, multiply BMR by an activity factor. These multipliers are commonly used planning categories, but they are rough guidelines rather than precise measurements. Your actual TDEE can vary based on the type, intensity, and duration of your exercise, as well as non-exercise activity thermogenesis (NEAT) such as walking, fidgeting, and household chores.
- Sedentary: BMR x 1.2 (little or no exercise, desk job).
- Lightly active: BMR x 1.375 (light exercise 1 to 3 days per week).
- Moderately active: BMR x 1.55 (moderate exercise 3 to 5 days per week).
- Very active: BMR x 1.725 (hard exercise 6 to 7 days per week).
- Extra active: BMR x 1.9 (very hard daily exercise or a physically demanding job).
Activity multipliers are rough categories, not guarantees. For practical examples, search for activity factor TDEE sedentary lightly active moderately active and compare descriptions with your actual week. Many people overestimate exercise intensity and underestimate sitting time, so it is often better to start conservatively and adjust after tracking results.
| Profile | Height | Weight | BMR (kcal/day) | Moderate TDEE (kcal/day) |
|---|---|---|---|---|
| 30-year-old male | 175 cm | 75 kg | 1,699 | 2,633 |
| 30-year-old female | 165 cm | 62 kg | 1,340 | 2,077 |
| 45-year-old male | 178 cm | 80 kg | 1,692 | 2,623 |
| 45-year-old female | 162 cm | 68 kg | 1,306 | 2,024 |
| 60-year-old male | 172 cm | 78 kg | 1,560 | 2,418 |
| 60-year-old female | 160 cm | 65 kg | 1,189 | 1,843 |
BMR by age and sex
BMR changes throughout life due to shifts in body composition, hormonal activity, and metabolic efficiency. The table below illustrates how BMR typically declines with age for male and female formula inputs when height, weight, and formula are held constant. Notice that the gap between male and female BMR values persists across all age groups, reflecting average differences in lean body mass. For a deeper look into how age affects resting metabolism, you can search for how age affects basal metabolic rate and review studies on age-related metabolic changes.
| Age | Male BMR (kcal/day) | Female BMR (kcal/day) | Difference (kcal/day) |
|---|---|---|---|
| 20 | 1,749 | 1,583 | 166 |
| 30 | 1,699 | 1,533 | 166 |
| 40 | 1,649 | 1,483 | 166 |
| 50 | 1,599 | 1,433 | 166 |
| 60 | 1,549 | 1,383 | 166 |
| 70 | 1,499 | 1,333 | 166 |
Each decade reduces BMR by roughly 50 calories per day for this profile, which over a year translates to approximately 18,250 fewer calories burned at rest. This underscores why adjusting calorie intake progressively with age is important for weight maintenance.
Using BMR for weight management
- Weight loss: aim for a calorie deficit below your daily estimate. A deficit of 300 to 500 calories per day is generally considered sustainable for gradual weight loss of about 0.25 to 0.5 kg per week. Larger deficits may produce faster initial results but are harder to maintain and may lead to muscle loss.
- Weight gain: aim for a calorie surplus above your daily estimate. For muscle gain, a surplus of 200 to 400 calories per day combined with resistance training is typically recommended. Excessive surpluses tend to produce more fat gain than muscle.
- Maintenance: match intake to a realistic activity level estimate and adjust over time based on actual weight trends. Tracking your weight weekly and averaging the readings gives a clearer picture than daily fluctuations.
This calculator provides estimates based on standard formulas. Individual metabolic rates may differ due to genetics, medication, medical conditions, and lifestyle factors that are not captured by any equation. For personalized advice, always consult a registered dietitian or healthcare provider.
| Goal | Daily calorie target | Expected weekly change | Best paired with |
|---|---|---|---|
| Aggressive fat loss | Estimated TDEE - 500 to 750 kcal | 0.5 to 0.75 kg loss | High-protein diet, resistance training |
| Moderate fat loss | Estimated TDEE - 300 to 500 kcal | 0.25 to 0.5 kg loss | Balanced macronutrients, cardio |
| Weight maintenance | Estimated TDEE | Stable weight | Consistent eating and exercise routine |
| Lean muscle gain | Estimated TDEE + 200 to 400 kcal | 0.1 to 0.25 kg gain | Progressive overload strength training |
| Bulk phase | Estimated TDEE + 400 to 600 kcal | 0.25 to 0.5 kg gain | Heavy compound lifts, calorie-dense meals |
BMR, TDEE, and dietary nutrients
Your daily energy expenditure is influenced not only by BMR, body composition, and activity but also by the macronutrients you consume. Protein has a higher thermic effect of food (TEF) compared to carbohydrates and fats, meaning your body burns more calories digesting and metabolizing protein. Carbohydrates and fats have a lower TEF, but they play essential roles in fueling workouts and supporting hormonal function. Understanding how macronutrients interact with total daily energy expenditure can help you design a diet that supports your calorie target rather than working against it. For more on how different foods affect energy expenditure, search for thermic effect of food protein carbs fat BMR and compare the metabolic cost of each macronutrient.
| Macronutrient | Thermic effect (%) | Calories burned per 100 kcal consumed | Impact on BMR planning |
|---|---|---|---|
| Protein | 20 to 30% | 20 to 30 kcal | Higher protein intake may slightly increase daily energy burn; useful during a deficit. |
| Carbohydrates | 5 to 10% | 5 to 10 kcal | Moderate TEF; primary fuel for high-intensity exercise and brain function. |
| Fats | 0 to 5% | 0 to 5 kcal | Lowest TEF; essential for hormone production and absorption of fat-soluble vitamins. |
BMR myths and misconceptions
Many misconceptions surround basal metabolic rate, and understanding what BMR is not can be just as important as understanding what it is. One common myth is that eating very few calories will speed up metabolism, when in fact severe calorie restriction often triggers metabolic adaptation, causing BMR to drop as the body conserves energy. Another widespread belief is that certain foods such as green tea, chili peppers, or cold water can significantly boost BMR. While these may produce a small, temporary increase, the effect is negligible compared to the impact of muscle mass, age, and overall calorie balance. A third misconception is that BMR is fixed and cannot change. In reality, BMR can be increased over time by building lean muscle through resistance training, eating sufficient protein, and maintaining consistent sleep and activity patterns. For more on what truly influences your resting metabolism, search for common BMR myths metabolic adaptation debunked and compare evidence-based findings with popular diet claims.