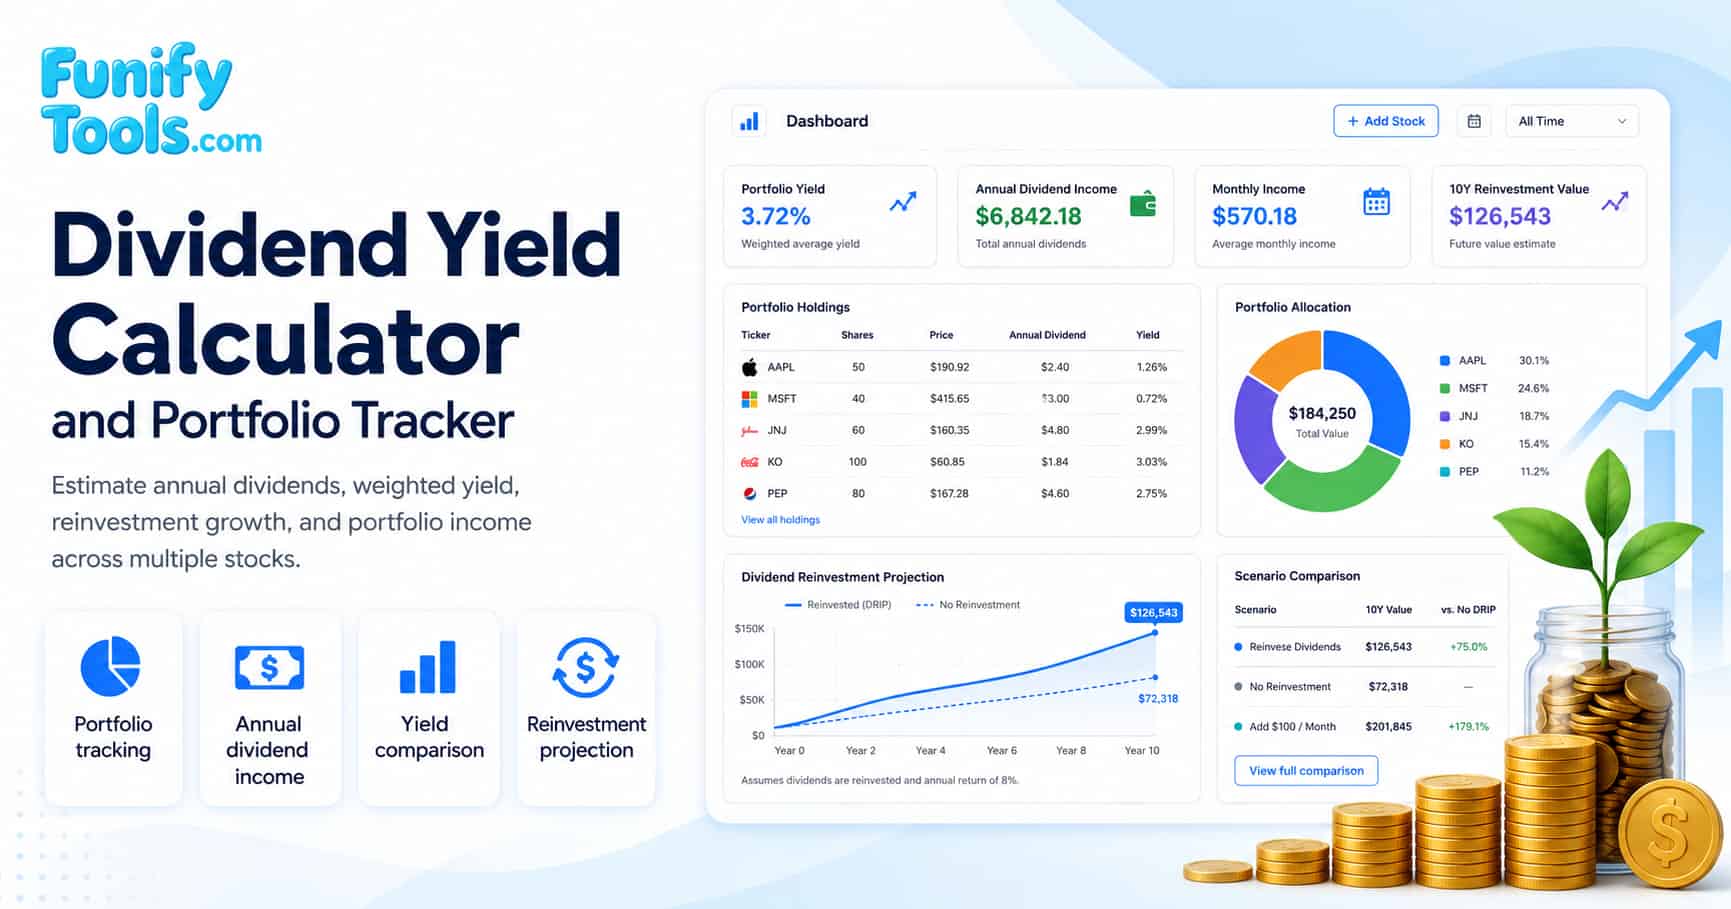
How to use the calculator
Add each stock with price, shares, dividend per share, payment frequency, dividend growth rate, and optional reinvestment. The calculator computes total investment, estimated annual dividend income, portfolio dividend yield, and a multi-year dividend income projection for the holdings you add. The portfolio view supports up to several holdings at once, making it easy to compare dividend stocks side by side under the same set of assumptions.
This dividend yield calculator is useful when you want to estimate income from one stock, compare several dividend stocks, or review a dividend portfolio as a single income stream. It can also help you test how dividend reinvestment, dividend growth, and different position sizes may change long-term income. For broader examples, search Google for dividend yield calculator annual dividend income portfolio and compare how different tools treat dividend frequency and reinvestment assumptions. You can also search Google for best dividend tracking portfolio spreadsheet free to see how manual tracking methods compare with an online calculator approach.
Choosing the right inputs
The quality of a dividend income estimate depends on the data you enter. Use the same dividend convention for every holding: if the dividend per share field represents one quarterly payment, choose quarterly; if it represents the full annual dividend, choose annually. Mixing annual and per-payment dividends is one of the easiest ways to overstate or understate expected income. Always verify dividend data from a reliable source such as the company investor relations page or a financial data provider before entering it into any dividend calculator.
For stock price, use the current market price or the price you want to test as a scenario. For shares, enter the number of shares you own or plan to buy. The calculator uses these values to estimate investment value, weighted yield, and how many additional shares could be purchased when reinvestment is enabled. Price and shares together determine the weight of each holding in the portfolio, so accurate share counts are just as important as accurate dividend figures.
- Use current dividend data when estimating near-term income.
- Use conservative growth assumptions for long projections, especially with cyclical or high-yield stocks.
- Check payment frequency before comparing monthly, quarterly, semi-annual, and annual dividend stocks.
- Enter zero dividend growth when you want a flat-income baseline.
Dividend frequency directly affects annual income calculations. The table below shows how the same dividend per share produces different annual income depending on how many payments are made each year.
| Frequency | Payments per year | Annual income per share (at $0.50 DPS) | Common stock types |
|---|---|---|---|
| Monthly | 12 | $6.00 | REITs, certain ETFs |
| Quarterly | 4 | $2.00 | Most US common stocks |
| Semi-annually | 2 | $1.00 | Many international stocks |
| Annually | 1 | $0.50 | Some foreign ADRs |
Understanding dividend yield
Dividend yield measures annual dividend per share relative to stock price. A stock paying $2.00 per share each year at a $50.00 share price has a 4% dividend yield before taxes and fees. Yield can change when the company raises or cuts its dividend, and it can also change when the share price moves. A falling stock price can push the dividend yield higher even when the dividend amount stays the same, which is why yield alone should never be used to evaluate a dividend stock.
High dividend yield is not automatically better. A high yield may reflect a strong income stream, but it can also reflect a falling stock price or a dividend that investors believe may be reduced. Weighted portfolio yield helps you see the income ratio across all holdings instead of focusing on a single headline yield from one position. For a deeper look at how different yield levels compare in practice, search Google for high yield vs dividend growth stocks total return comparison to see historical performance data across market cycles.
Portfolio yield is especially helpful when your dividend portfolio includes stocks with very different allocations. A small position with a very high yield may look attractive by itself, but it may contribute less income than a larger position with a moderate yield. Weighted yield keeps the comparison anchored to actual dollars invested. This distinction matters because a portfolio that chases the highest individual yields may end up with lower total income if those high-yield positions are small.
- Dividend yield compares annual dividend income with the current share price.
- Annual dividend income depends on shares owned, dividend amount, and payment frequency.
- Weighted yield: portfolio yield weighted by investment size
Key formulas used
Investment = price x shares
Income = dividend/share x payments/year x shares
Portfolio yield = total annual dividend income / total investment x 100
The projection applies dividend growth each year and, when reinvestment is enabled, uses a share of dividend income to buy additional shares at the entered stock price. This is a simplified dividend reinvestment model because it assumes a constant share price and does not account for taxes, brokerage rules, fractional share limits, or changes in dividend policy. Search Google for dividend reinvestment calculator DRIP compound income to compare this simplified model with DRIP-style reinvestment examples.
| Input | What it means | Effect on result |
|---|---|---|
| Stock price | Current price per share used for investment value. | Changes yield and reinvested share estimates. |
| Dividend per share | Dividend payment per share for one payment period. | Raises annual dividend income. |
| Dividend frequency | How many dividend payments happen per year. | Converts one payment into annual income. |
| Dividend growth | Annual growth assumption for future payments. | Changes the projection curve. |
| Reinvestment rate | Share of dividend income assumed to buy more shares. | Increases projected shares and future income when enabled. |
| Projection years | Length of the forward-looking dividend income estimate. | Controls how far the chart and final-year dividend estimate extend. |
Reading the result
The main result shows estimated annual dividend income and total investment. The details table adds weighted dividend yield, number of holdings, projection years, and projected final-year dividend income. Use these values together instead of looking only at yield. A portfolio with lower yield but stronger dividend growth may project differently from a high-yield portfolio with no growth. The projection chart visualizes how dividend income could evolve year by year under your chosen growth and reinvestment assumptions.
The allocation chart shows how much of the portfolio is concentrated in each holding. The income and projection charts help you compare current income with future estimated income under your assumptions. If one stock dominates the allocation or most of the dividend income, consider reviewing sector exposure, payout ratio, and dividend history outside this calculator. Diversification across sectors is a common principle in dividend investing because it reduces the impact of a single company cutting or suspending its dividend.
Below is a comparison of how different dividend growth rates affect projected income over time. This table illustrates why growth assumptions matter as much as current yield when evaluating dividend stocks for long-term income.
| Dividend growth rate | Year 1 income ($10K investment, 4% yield) | Year 5 income (no reinvestment) | Year 10 income (no reinvestment) |
|---|---|---|---|
| 0% (flat) | $400 | $400 | $400 |
| 3% | $400 | $450 | $522 |
| 6% | $400 | $505 | $676 |
| 10% | $400 | $585 | $943 |
Practical tips
- High yield can signal risk. Check dividend sustainability outside this tool.
- Fixed stock price assumptions in projections are simplified. Real prices move.
- Use scenarios to compare different reinvestment rates and dividend growth assumptions.
- Compare annual dividend income in dollars, not just percentage yield.
- Review whether dividend growth assumptions are realistic for each company and sector.
When comparing dividend stocks, review payout ratio, free cash flow, earnings stability, dividend history, debt levels, and sector concentration. Dividend yield is only one part of income investing research. Search Google for dividend sustainability payout ratio dividend growth stocks before treating a high yield as stable income. You can also search Google for dividend aristocrats list 2026 consecutive increases to find stocks with long track records of raising dividends.
Common dividend investing strategies
Different investors use different approaches to build dividend portfolios. The strategy you choose affects which stocks you add, how you set dividend growth assumptions, and whether reinvestment is a priority. The table below summarizes several well-known dividend investing strategies and how they relate to the inputs in this calculator.
| Strategy | Focus | Typical yield range | Reinvestment priority |
|---|---|---|---|
| Dividend growth | Companies with consistent dividend increases over time | 1% to 3.5% | High, because compounding accelerates growth |
| High yield | Stocks with above-average current dividend income | 4% to 8% | Moderate, because income is the primary goal |
| Dividend aristocrat | Companies with 25+ years of dividend increases | 2% to 4% | High, because reliable growth supports compounding |
| Income & value | Dividend stocks with attractive valuation metrics | 3% to 5% | Moderate to low, depending on investor goal |
| REIT / passive income | Real estate investment trusts and income-focused ETFs | 4% to 10% | Low, because monthly cash flow is the objective |
Each strategy has different implications for the inputs you enter. A dividend growth investor would set a moderate current yield with a meaningful dividend growth rate and enable reinvestment. A high-yield income investor might set a higher current yield with a lower or zero growth rate and focus on the annual income figure rather than the projection curve. Use the scenario comparison feature in the calculator to test how each strategy might perform under your own assumptions.
References
Dividend yield overview | Portfolio overview | Dividend basics from Investor.gov