Why break-even matters
Average purchase price is useful for tracking cost basis across multiple buys, but it does not include trading fees unless you manually include them. To estimate the price level that covers your acquisition cost before any future selling fees, use break-even price, which adds the commission and tax amounts entered for the purchase rows. Understanding this break-even point helps investors set realistic profit targets and avoid treating a fee-adjusted loss as a gain.
A break-even average purchase calculator is most useful when one position has several buy orders at different prices. Instead of judging the position by the latest order price, the calculator combines every purchase row into one weighted average purchase price and one fee-inclusive break-even price. This makes it easier to decide whether a target sell price actually covers the full cash outlay. Without this calculation, traders risk underestimating the true cost of their position and accepting sell prices that yield a net loss after fees.
Averaging down, scaling into a position, and splitting orders can make the real cost basis harder to read from memory. If you want broader examples, try a Google search for average purchase price calculator stock cost basis and compare how brokers define cost basis versus trade value. Many brokerage platforms display only the simple average, which omits fee impact and can mislead short-term traders.
Average purchase price vs break-even price
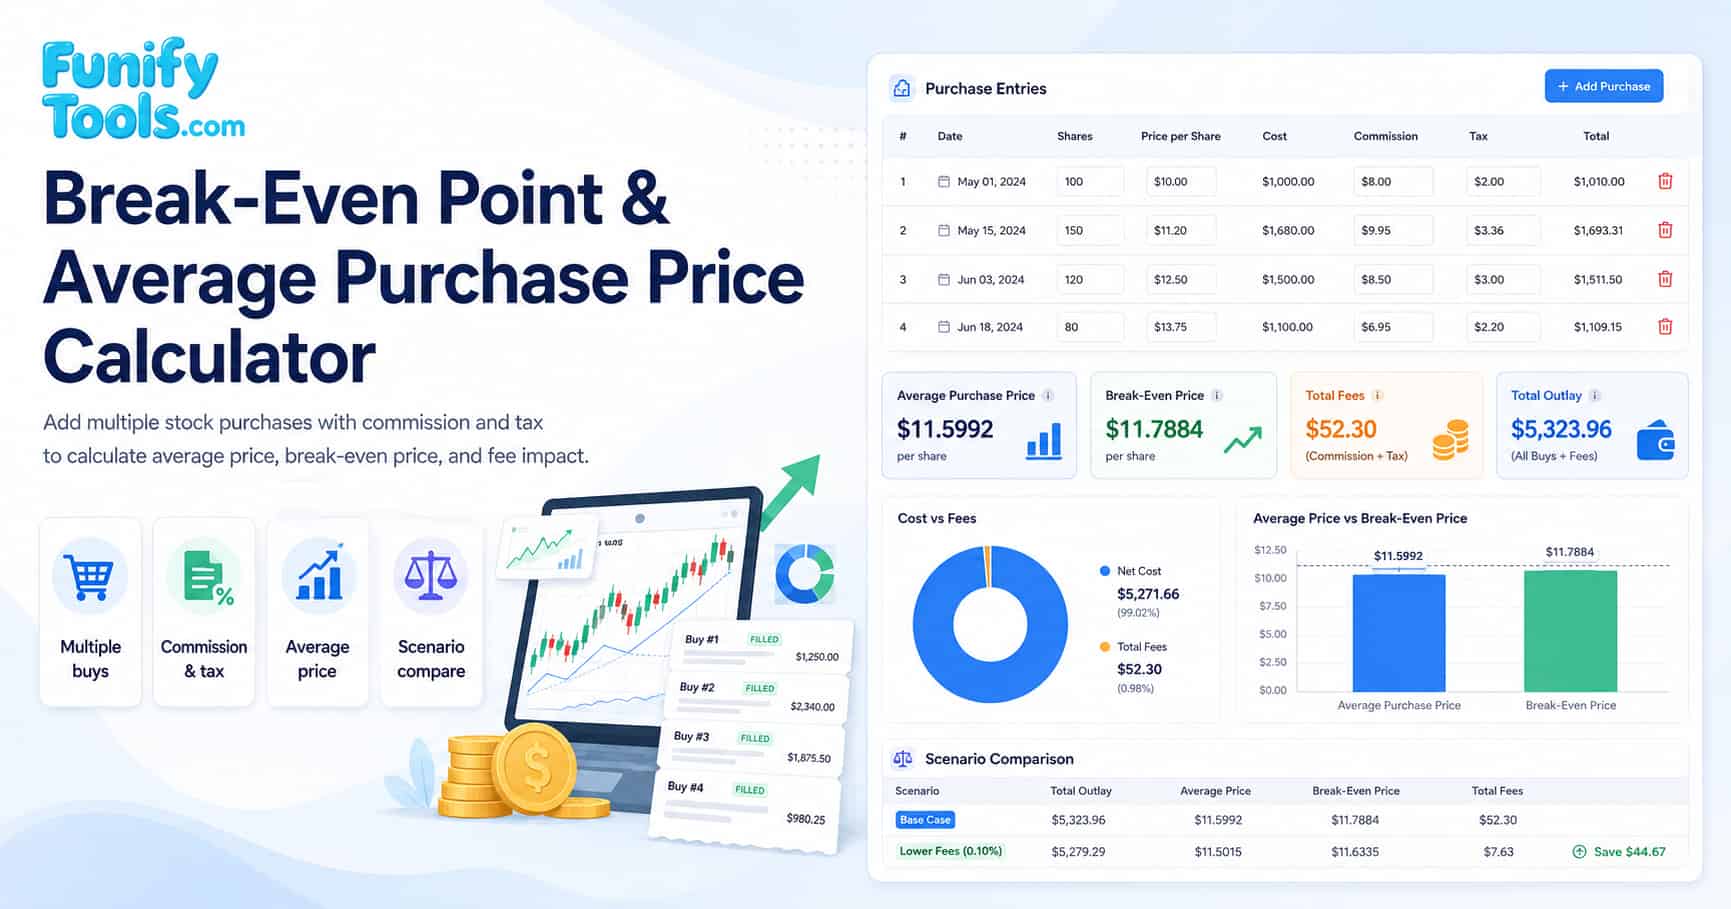
Average purchase price answers a narrow question: how much did each share cost before separate fees? Break-even price answers a more practical question: what per-share price would cover the shares, commissions, transaction taxes, and similar direct costs entered in the calculator, before any future selling fees?
For example, if two purchases have the same share count but different costs, the average purchase price sits halfway between those two cost-per-share values. If one purchase is much larger, the weighted average moves closer to that larger purchase. This weighted average method is why entering shares and total cost per row gives a more realistic result than simply averaging the individual buy prices. The distinction between simple average and weighted average is a common source of confusion among new investors.
The break-even price is usually higher than the average purchase price because commission and tax are added to total outlay. The difference may look small per share, but it can matter when a position has many shares, frequent trades, or a market with transaction taxes. That difference is shown as fees per share in the result chart. Over a series of trades, accumulated fees can represent a meaningful percentage of total investment, which is why the fee-per-share metric deserves close attention.
Formulas
Avg = total cost / total shares
BE = total outlay / total shares
Outlay = cost + commission + tax
When you add multiple purchase rows, the tool aggregates shares, cost, commission, and tax across rows before computing the final per-share values.
The calculator treats the cost field as the trade value before the separate commission and tax fields. If your broker already includes fees in the reported cost, enter those fees as zero to avoid counting them twice. If your broker separates settlement amount, commission, regulatory fees, and tax, enter the share purchase value as cost and put the direct fees in the fee fields.
For deeper reading about tax lots and reporting language, search Google for stock cost basis tax lot average cost explained. Those terms matter because a broker statement may track tax lots differently from a simple weighted-average view. Understanding tax lot accounting is especially important when selling partial positions, as the IRS and many tax authorities allow specific identification of shares.
| Formula component | Description | Real-world example |
|---|---|---|
| Total shares | Sum of all shares across every purchase row. | 100 + 200 = 300 shares |
| Total cost | Sum of all purchase amounts before fees. | $2,000 + $4,500 = $6,500 |
| Average purchase price | Total cost divided by total shares. | $6,500 / 300 = $21.67 |
| Break-even price | Total outlay (cost + fees) divided by total shares. | ($6,500 + $25) / 300 = $21.75 |
Factors and fees
- Commission fees: broker commissions increase total cost and raise break-even price.
- Tax fees: some markets apply transaction taxes or duties, which also raise break-even price.
- Multiple purchases: accurate input per row matters, especially when fees differ by trade size.
Tax is often a percentage of transaction value, but this calculator accepts direct amounts per purchase row. That keeps the tool flexible for markets where fees are shown as fixed amounts, percentage-based charges, stamp duties, or a combination of several line items on a trade confirmation. Some jurisdictions apply a sliding scale where larger trades incur a lower percentage fee, while others charge a flat rate per trade regardless of size.
Currency also matters. Use one currency consistently across all purchase rows. If some trades were made in another currency, convert cost and fees before entering them, or the average purchase price and break-even price will mix unlike values. Foreign exchange fluctuations can introduce additional cost that is not captured by the calculator, so consider using the spot rate at the time of each trade for the most accurate result.
| Input | What it represents | Effect on result |
|---|---|---|
| Shares | Number of shares bought in one purchase row. | More shares spread fixed fees across more units. |
| Total cost | Purchase amount before separate fees. | Raises the average purchase price. |
| Commission | Broker fee paid for that purchase. | Raises break-even price but not the basic average price. |
| Tax | Transaction tax, duty, or similar fee. | Raises total outlay and fee per share. |
| Fee type | Common in markets | Typical calculation method |
|---|---|---|
| Broker commission | All major exchanges | Flat fee per trade or percentage of trade value |
| Transaction tax | UK (stamp duty), Hong Kong, India, South Korea | Percentage of purchase or sale value |
| Regulatory fee | US (SEC fee), EU (MiFID II) | Small percentage of trade value, often capped |
| Exchange fee | Most stock exchanges | Per-share or per-order fee set by the exchange |
Example workflow
For each buy, enter shares, total cost paid, commission amount, and tax amount. After calculation, compare break-even price versus average price. The gap between them is driven by fees. The charts visualize how much of your total outlay is cost versus fees.
A practical workflow is to add one row for each executed buy order, not one row for each trading day. If a day had two fills at different prices or with different fees, separate rows preserve the real weighted average. After the first result, use the scenario comparison area to save a version, adjust a new row, and see how a planned purchase would change your break-even point.
Investors often use this type of average cost calculator before averaging down, trimming a position, or setting a target sell price. Traders may use it to estimate whether a short-term exit price covers fees. Long-term investors may use it as a simple check against portfolio tracking spreadsheets. Regardless of your trading style, running a quick calculation before placing an order helps prevent unpleasant surprises at settlement time.
If you are planning another order, a Google search for stock break-even price with commission and transaction tax can help you review common fee types before entering the next scenario. Comparing your own fee structure with published examples can also reveal whether your broker charges above-market rates.
Limitations and tips
- Real broker statements may include additional fees, FX spreads, routing fees, or rounding rules.
- If you want fees included in average price, you can add fees into the cost field manually, but then break-even will double count unless you set fees to zero.
- Use this tool as an educational reference and verify using your broker records.
This calculator does not determine taxable gain, wash sale adjustments, corporate actions, dividends, split adjustments, or official tax basis. It is designed for quick planning and comparison, not for filing tax documents. If tax reporting is the goal, compare the estimate with your broker statement and local rules. A Google search for how to calculate stock cost basis for tax reporting multiple buys provides official guidance from tax authorities on acceptable cost basis methods.
For cleaner records, keep the same input style every time: either enter pre-fee trade value plus separate fees, or enter fee-included cost with zero fees. Mixing both styles across rows can make the result look precise while hiding inconsistent assumptions.
References
Break-even point overview | Cost basis overview | Stock market overview