Why gas pressure matters
Gas pressure links microscopic motion to everyday observations. Countless situations involve gases in containers, from spray cans and scuba tanks to air inside a classroom. Pressure tells how strongly the gas pushes on the walls of its container. When pressure changes, that push changes, and so do the behaviors built on it. Understanding gas pressure is fundamental in chemistry, physics, meteorology, and engineering because it governs how gases behave under different conditions.
In many courses, students see ideal gas problems as a chain of symbols. Writing P, V, n, R, and T on paper is only half of the picture. The calculator on this page turns those symbols into numbers you can see immediately. It helps connect the equation PV = nRT to simple stories such as squeezing a plunger, heating a balloon, or adding more gas to a sealed tank. For a broader search path, compare textbook explanations through Google results for ideal gas law PV=nRT pressure calculator. You can also explore how pressure relates to weather systems by searching for atmospheric pressure weather forecast explained.
Ideal gas law basics
The ideal gas law joins four measurable quantities in one equation. It is one of the most widely used relationships in physical science and appears in thousands of textbook problems each year.
- P: pressure, typically in atmospheres (atm), pascals (Pa), or kilopascals (kPa)
- V: volume, usually in liters (L) or cubic meters (m³)
- n: amount of substance in moles (mol)
- T: absolute temperature in Kelvin (K)
- R: gas constant that sets the scale between units
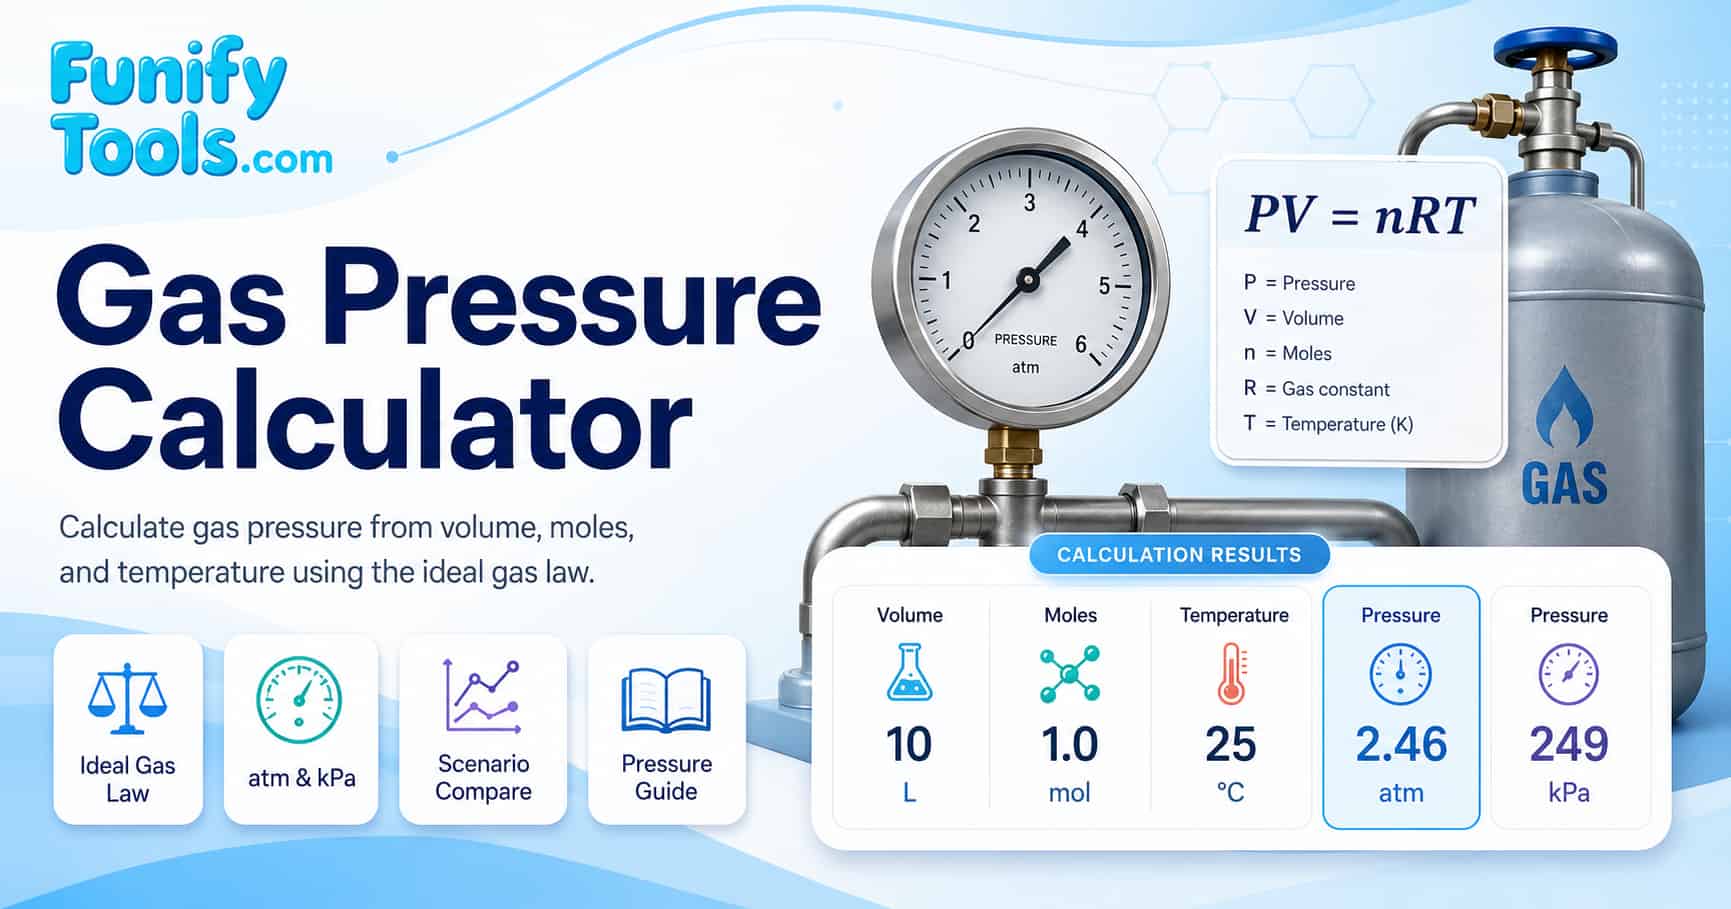
In compact form, the relationship is written as PV = nRT. If three of the four variables are known, the fourth can be calculated. On this page, the calculator solves for pressure:
P = nRT / V
When students practice with this relationship, they can see several patterns:
- At fixed n and T, pressure is inversely proportional to volume. If volume is halved, pressure ideally doubles.
- At fixed n and V, pressure is directly proportional to temperature in Kelvin. If temperature doubles, pressure ideally doubles.
- At fixed V and T, pressure is directly proportional to moles of gas. More particles in the same space mean more collisions and higher pressure.
These proportional relationships form the foundation of the combined gas law and are tested regularly in high school and college-level science courses. For additional practice problems, check Google results for ideal gas law practice problems with solutions.
Inputs and units in this tool
The calculator uses standard scientific units that match many textbook examples. It takes care of the conversion from Celsius to Kelvin and displays pressure in a consistent pair of units. Understanding these units is essential for correctly applying the ideal gas law in any context.
Volume
- Input volume in liters.
- One liter is one thousand cubic centimeters (1 L = 1000 cm³).
- If a problem gives milliliters, divide by one thousand to convert to liters.
- For cubic meters, multiply by 1000 to obtain liters.
Moles
- Moles describe the amount of substance using Avogadro's number (6.022 × 10²³ particles per mole).
- In many school problems, moles are calculated from mass and molar mass before being used in the gas law.
- The formula n = mass / molar mass is the standard way to convert grams to moles.
Temperature
- The calculator accepts temperature in degrees Celsius.
- It converts to Kelvin internally by adding 273.15, because the ideal gas law requires an absolute scale.
- Absolute zero is 0 K, equivalent to -273.15 °C, the lowest possible temperature in the universe.
Pressure and R
- Pressure is shown in atmospheres and kilopascals simultaneously.
- For atm, a common gas constant is 0.08206 L·atm/(mol·K).
- For kPa, a common gas constant is about 8.314 L·kPa/(mol·K) or 8.314 J/(mol·K) in SI units.
| Quantity | Symbol | Calculator input or constant | Why it matters |
|---|---|---|---|
| Pressure | P | Displayed in atm and kPa | The result being solved from the other gas law variables. |
| Volume | V | Liters (L) | Pressure falls as volume increases when moles and temperature stay fixed. |
| Amount of gas | n | Moles (mol) | More particles in the same container create more collisions. |
| Temperature | T | Celsius input, Kelvin calculation | Gas law calculations require absolute temperature. |
| Gas constant | R | 0.08206 or 8.314, depending on units | The unit system determines which constant matches the equation. |
Common gas constant values
The gas constant R appears in the ideal gas law and takes different numerical values depending on the units used for pressure, volume, and temperature. Choosing the correct R is one of the most common sources of error in gas law calculations. The table below lists the most frequently encountered values.
| Value of R | Units | Common use case |
|---|---|---|
| 0.08206 | L·atm / (mol·K) | Pressure in atm, volume in liters |
| 8.314 | L·kPa / (mol·K) | Pressure in kPa, volume in liters |
| 8.314 | J / (mol·K) | SI unit system, energy calculations |
| 62.364 | L·mmHg / (mol·K) | Pressure in millimeters of mercury |
| 0.08314 | L·bar / (mol·K) | Pressure in bar, common in European textbooks |
This calculator uses 0.08206 for atm results and 8.314 for kPa results, which cover the two most common unit combinations found in high school and undergraduate chemistry courses.
Changing volume at constant moles and temperature
At fixed temperature and moles of gas, pressure changes when volume changes. This behavior connects the ideal gas law to Boyle-style experiments. At constant n and T, PV is constant, so pressure is proportional to one divided by volume. This inverse relationship is one of the oldest experimentally verified gas laws and was first documented by Robert Boyle in the 17th century.
To see this effect in the calculator, pick a sample label and enter values for moles and temperature. Choose a volume and calculate. Then change only the volume while leaving moles and temperature the same. Add each result as a separate scenario and compare the pressure columns.
- When volume is reduced, pressure increases in the same proportion.
- When volume is expanded, pressure falls, and the result charts make the size of the change easier to see.
- The scenario table makes it easy to compare how strong the change is from one setup to the next.
Changing temperature at constant volume
When volume and moles stay fixed, pressure changes in direct proportion to absolute temperature. Doubling temperature in Kelvin ideally doubles pressure. This behavior is closely related to Gay-Lussac's law, also called Amontons's law, and is expressed here through the combined ideal gas law. In real-world terms, this is why a car tire's pressure rises on a hot day and drops in cold weather.
In many introductory courses, this relationship is used to interpret heating and cooling situations. The calculator helps students check their intuition by letting them adjust temperature while holding volume and moles steady. To review the temperature conversion piece separately, this Google search for Celsius to Kelvin ideal gas law is a useful companion.
- Enter an initial temperature in Celsius and calculate pressure.
- Increase temperature while keeping volume and moles fixed and calculate again.
- Add both runs as scenarios and compare their pressure columns with the charts as a quick visual summary.
Changing moles at fixed volume and temperature
The number of moles describes how many particles are present. At constant volume and temperature, adding more moles leads to more frequent collisions with the container walls and thus higher pressure. Removing moles has the opposite effect. This direct proportionality between n and P is intuitive: more gas in the same space means more force against the walls.
This calculator makes it easy to explore that dependence. Students can start with a small amount of gas in a fixed volume, then gradually increase moles while leaving volume and temperature unchanged.
- Create one scenario with a certain number of moles and record its pressure.
- Double the moles while holding volume and temperature constant and calculate again.
- Observe how pressure scales in the scenario table and how the reference chart highlights the change.
atm and kPa side by side
Pressure appears in many unit systems. This calculator focuses on two common classroom units: atmospheres and kilopascals. An atmosphere (atm) is built on the approximate pressure at sea level. Kilopascal (kPa) units arise naturally from the pascal, which measures force per area in the metric system. Understanding both units is important because different textbooks and regions prefer different conventions.
Every time you calculate, the result appears in both atm and kPa. The summary section highlights whichever you choose as the focus unit, and the chart area places the current result beside familiar references. This helps students avoid unit conversion mistakes and see how the two scales relate.
- At 1 atm, pressure is about 101.3 kPa.
- At 2 atm, pressure is about 202.6 kPa.
- Seeing both numbers at once is useful when switching between textbook conventions.
Pressure comparison across everyday situations
Understanding how pressure values relate to real-world objects helps build intuition. The table below compares common pressure references so you can see how calculated results fit into everyday experience.
| Situation | Pressure (atm) | Pressure (kPa) | Notes |
|---|---|---|---|
| Standard sea level atmosphere | 1.00 | 101.3 | Reference point for all gas law calculations |
| Car tire (typical absolute estimate) | 3.2 | 320 | Approx. 220 kPa gauge plus atmospheric pressure |
| Scuba tank (full) | 200 | 20,265 | Compressed air for underwater use |
| Pressure cooker | 1.5-2.0 | 150-200 | Elevated pressure for faster cooking |
| Vacuum cleaner suction | 0.8 | 80 | Slightly below atmospheric pressure |
This reference table helps put the calculator's output into perspective. A result of 2.5 atm, for example, is roughly what you might find inside a bicycle tire, while 0.5 atm represents about half the pressure at sea level, similar to conditions at high altitude. For more information on how altitude affects pressure, search for atmospheric pressure vs altitude table.
Classroom and homework uses
Many gas law problems share the same structure but vary in numbers and conditions. The calculator is designed to support that workflow rather than replace it. Students can attempt a problem by hand, then use the tool to check intermediate steps or final answers.
In a lesson, the scenario table works well as a visual summary for small groups. Each student can propose one scenario, enter the values, and then compare how pressure behaves. The charts help make abstract relationships feel more concrete.
- Use scenario labels to keep track of which row belongs to which problem or student.
- Display the table on a shared screen and discuss how changes in volume, temperature, or moles move the pressure columns.
- Use recent runs and saved notes to keep a record of class examples or lab-style demonstrations.
Simple lab-style scenarios
Even without a full laboratory, simple thought experiments can connect numbers to physical events. The guide below outlines a few structured ideas that pair naturally with this calculator.
- Heating a sealed container: Imagine a rigid steel can filled with gas. If the temperature rises while volume stays fixed, the calculator shows how much pressure changes and whether it roughly matches textbook expectations.
- Compressing a syringe: Model a syringe as a constant temperature system where volume is reduced by half or a third. The pressure column then shows how much the internal gas would push back in an ideal model.
- Adding gas to a tank: Keep volume and temperature fixed and increase moles in steps. Observing how pressure climbs with each step reinforces the direct proportionality between pressure and amount of gas.
Each of these scenarios can be set up quickly in the calculator, saved as recent runs, and stored in Funify Notes alongside written explanations.
| Scenario | Volume (L) | Moles (mol) | Temperature (°C) | Expected pressure range |
|---|---|---|---|---|
| Heating a sealed can | 1.0 | 0.10 | 25 to 100 | 2.4 to 3.1 atm |
| Compressing a syringe | 0.5 to 0.1 | 0.05 | 25 | 2.4 to 12.2 atm |
| Adding gas to a tank | 2.0 | 0.05 to 0.20 | 25 | 0.6 to 2.4 atm |
Limits of the ideal gas model
The ideal gas law is a model, not a complete description of real gases. It works best when particles are far apart and interact only through brief collisions. At high density or low temperature, real gases feel their neighbors more strongly and can depart noticeably from ideal behavior.
The calculator on this page is therefore an educational approximation. It does not include correction terms from more advanced equations of state. When a problem involves high pressure, low temperature, or gases near condensation, it is worth comparing against real-gas discussions such as Google results for real gas deviation from ideal gas law. In practice, that means:
- It is well suited for classroom style problems and many moderate condition scenarios.
- It is not designed for engineering decisions where safety margins are small.
- It does not model phase changes such as gas condensing to liquid.
Safety notes
This calculator is designed for learning and homework. It does not replace safety calculations for pressurized equipment or experiments. Real pressure vessels, gas cylinders, and industrial lines must follow formal standards and manufacturer specifications.
In a teaching lab or classroom, standard safety habits still apply. Eye protection, careful handling of glassware, and respect for gas cylinders are important even when the numerical work feels routine.
- Use pressure ratings supplied by equipment manufacturers when planning experiments.
- Do not use this ideal gas calculator to decide on limits for physical tanks or pipes.
- Refer to local laboratory safety guidelines for all hands-on work.
References
Wikipedia Ideal gas law | Gas laws overview | Atmosphere as a unit | Pascal and kilopascal