Why per 100 g inputs
Food labels and major databases such as the USDA FoodData Central often standardize nutrition as "per 100 g." This makes scaling clean: weigh your ingredient, multiply by the per 100 g value, then divide by 100. It avoids confusion from inconsistent serving sizes between brands or recipes, especially when one product calls a serving 28 g and another calls a serving 40 g. Using a standard reference also makes it easier to compare two similar ingredients side by side without recalculating.
For example, if an ingredient has 250 kcal per 100 g and you use 36 g, the energy contribution is 250 x 36 / 100 = 90 kcal. The same pattern applies to carbohydrates, protein, fat, sugars, caffeine, and any other nutrient that is entered as a per 100 g value. Once you get used to this method, checking nutrition for any amount becomes fast and repeatable across different recipes and meal prep sessions.
Macronutrients basics
Macronutrients create most of the energy in a recipe. Carbohydrates and protein provide about 4 kcal per gram, while fat provides about 9 kcal per gram. Because fat is energy dense, small amounts of oil, butter, nuts, seeds, or cheese can shift the result a lot. Fiber is sometimes listed separately and contributes minimal energy, but it matters for texture and satiety.
Macro ratios are useful when you are adjusting a recipe toward a goal. A pasta dish might need more protein per serving, a smoothie might need less sugar, and a sauce might need less fat if oil or cream is driving the total. If you want to compare broader references, you can search Google for macronutrients calories per gram while keeping your recipe numbers open here. The calculator uses the standard 4-4-9 conversion, which is widely accepted for general meal planning.
Nutrition density reference: common ingredient categories
The table below shows typical per 100 g ranges for broad ingredient categories. Use these as a starting point when you do not have a specific label. Actual values vary by brand, ripeness, cut, and preparation, so the manual entry option lets you override any value when you have a more accurate number.
| Ingredient category | Energy (kcal) | Carbs (g) | Protein (g) | Fat (g) |
|---|---|---|---|---|
| Leafy greens (spinach, kale, lettuce) | 15–40 | 2–7 | 1–3 | 0–1 |
| Non-starchy vegetables (broccoli, bell peppers, zucchini) | 20–50 | 3–10 | 1–3 | 0–1 |
| Starchy vegetables (potatoes, sweet potatoes, corn) | 80–120 | 17–27 | 1–3 | 0–1 |
| Legumes (lentils, chickpeas, black beans, cooked) | 110–140 | 18–25 | 7–9 | 0–1 |
| Whole grains (brown rice, quinoa, oats, cooked) | 110–140 | 20–28 | 3–5 | 1–3 |
| Lean meat and poultry (chicken breast, turkey, cooked) | 140–170 | 0 | 25–31 | 2–5 |
| Fish and seafood (salmon, cod, shrimp, cooked) | 80–210 | 0–5 | 17–25 | 1–13 |
| Eggs (whole, cooked) | 150–160 | 1–2 | 12–13 | 10–12 |
| Dairy (milk, yogurt, cheese) | 40–400 | 1–5 | 3–25 | 1–33 |
| Nuts and seeds (almonds, walnuts, chia, flax) | 550–700 | 5–20 | 15–25 | 45–65 |
| Oils and fats (olive, coconut, butter) | 800–900 | 0 | 0 | 90–100 |
| Fruits (apples, bananas, berries, oranges) | 50–100 | 12–25 | 0–1 | 0–1 |
This reference table is designed to help you estimate nutrition when you are building a recipe from scratch. The range format accounts for natural variation between varieties and preparation methods. For the most accurate result, always prefer the specific label or database entry for the exact product you are using.
Micronutrient notes
Vitamins and minerals matter for health, but they are harder to estimate precisely in homemade cooking. Values vary by cultivar, season, storage time, cooking method, and preparation technique. When the ingredient data includes vitamin or mineral names, the tool collects them as a reference list so you can see whether a recipe is leaning toward leafy greens, dairy minerals, legumes, whole grains, or fortified products.
This page intentionally treats micronutrients as informational rather than clinical. For everyday cooking, the most reliable improvements usually come from entering accurate ingredient weights, choosing nutrition values that match the product label, and repeating the same method from recipe to recipe. If you are interested in the vitamin and mineral content of a specific ingredient, you can search Google for vitamin mineral content per 100g food database and compare the values you find with the reference list shown in your result.
Cooking effects
Cooking does not destroy calories, but it changes weight. Water loss makes nutrients per gram look higher after cooking. Frying adds fat. Grilling may drip fat away. Boiling usually adds none unless you keep the cooking liquid. The safest approach is to be consistent: use raw ingredient values when you weigh raw ingredients, and cooked values when you weigh cooked leftovers or prepared foods. This consistency matters most when you are tracking macros across multiple days or comparing two versions of the same recipe.
If you are unsure whether to use raw or cooked nutrition data, search Google for raw vs cooked nutrition data per 100g and compare the source with how you actually weighed the ingredient. In general, using the state that matches how you measured the ingredient (raw or cooked) gives the most reliable result.
Cooking method impact on weight and nutrition
The table below summarizes how common cooking methods affect ingredient weight and nutrition density. Understanding these shifts helps you decide whether to enter raw or cooked values and how to adjust your ingredient list when a recipe calls for a specific preparation technique.
| Cooking method | Weight change | Nutrition density change | Best practice for this calculator |
|---|---|---|---|
| Boiling (pasta, rice, legumes) | Increases (water absorption) | Decreases per gram | Use cooked values if weighing after cooking; use dry values if weighing before cooking |
| Steaming (vegetables, fish) | Minimal change or slight loss | Minimal change | Raw or steamed values both work; steamed values are slightly more accurate |
| Roasting or baking (meat, vegetables) | Decreases (moisture loss) | Increases per gram | Use cooked values for roasted ingredients; raw values underestimate density |
| Pan frying or sautéeing | Decreases (moisture loss) plus added fat | Increases per gram significantly | Include cooking oil or butter as a separate ingredient to capture added fat |
| Deep frying | Decreases (moisture loss) plus significant fat absorption | Increases per gram substantially | Use deep-fried entries if available; otherwise add oil as a separate line item |
| Grilling or broiling | Decreases (moisture and fat drip loss) | Increases per gram | Use grilled values when available; fat loss can reduce total calories compared to pan frying |
| Slow cooking or braising | Decreases (moisture loss over time) | Increases per gram | Weigh after cooking and use cooked entries for the main ingredients |
| Microwaving | Minimal change | Minimal change | Raw values are usually acceptable unless significant moisture escapes |
This cooking method impact table helps you decide whether to adjust your ingredient entries based on how you prepared the food. When in doubt, entering the ingredient in its raw state and adding cooking fats separately is a safe default that keeps your nutrition estimates consistent and repeatable.
Accuracy tips
A kitchen scale is the single biggest accuracy upgrade. Tare your bowl, add ingredients gradually, and record grams. For oils, nut butters, seeds, cheese, dressings, and sauces, measure to the gram because small spoonfuls can add meaningful calories and fat. If you only know volume, convert to grams using reliable charts for that specific ingredient. Volume-based measurements like cups and tablespoons are especially inconsistent for dry ingredients such as flour, oats, and grated cheese.
For packaged foods, the label usually beats a generic database because brands differ in sugar, sodium, fat, and fortification. Use the manual entry panel when the label has a better number than the suggestion list. You can also search Google for nutrition label per 100g calculator when you need help converting label serving data into a 100 g basis. Over time, building a personal library of ingredients you use often will speed up your workflow and improve consistency.
Worked example
Suppose a bowl recipe makes 2 servings. You add cooked rice 200 g, chicken 150 g, avocado 60 g, and olive oil 10 g. If totals are 820 kcal, 95 g carbs, 62 g protein, and 28 g fat, then per serving is about 410 kcal, 47.5 g carbs, 31 g protein, and 14 g fat. The macro ratio in this example is roughly 46 percent carbs, 30 percent protein, and 24 percent fat by calorie share.
If your target nutrient is protein at 35 g per serving, the calculator reports a 4 g gap. If your target nutrient is calories at 450 kcal per serving, the same bowl is 40 kcal under that target. Switching the target nutrient lets the page support different use cases without pretending every recipe is only about protein. You can also use the scenario feature to compare what happens if you swap chicken for tofu or replace white rice with quinoa, and see how the per-serving numbers shift.
Using ratios for diets
Ratios help you align recipes with your approach. A high-protein bowl can help muscle maintenance and post-workout recovery. A lower-carb plate may fit some glucose management plans. Higher fat ratios can appear in keto-style cooking. A lower-sugar target can be useful for drinks, breakfasts, and desserts. Consistency across days matters more than one isolated calculation, so use this result as a practical planning reference rather than a medical prescription. If you are following a specific dietary guideline, compare your per-serving ratios against the recommended ranges for that pattern.
Macronutrient target ranges by dietary pattern
The table below shows typical macronutrient distribution ranges for common dietary approaches. Use these as a reference to see how your recipe's macro ratio compares to a target pattern. Individual needs vary by age, activity level, and health goals, so these are general guidelines rather than strict prescriptions.
| Dietary pattern | Carbs (% of calories) | Protein (% of calories) | Fat (% of calories) | Typical use case |
|---|---|---|---|---|
| Balanced (general health) | 45–60 | 10–20 | 20–35 | Everyday meal planning, family cooking |
| High protein (athletes, muscle gain) | 30–45 | 25–40 | 20–30 | Post-workout meals, bodybuilding prep |
| Lower carb (blood sugar management) | 20–40 | 20–30 | 35–50 | Glucose control, insulin sensitivity |
| Ketogenic (very low carb) | 5–10 | 15–25 | 65–80 | Ketosis, neurological applications |
| Mediterranean style | 40–50 | 15–20 | 30–40 | Heart health, plant-forward eating |
| Low fat (heart health, weight loss) | 55–70 | 15–20 | 10–20 | Cholesterol management, calorie density reduction |
| Plant-based or vegan | 50–65 | 10–20 | 20–35 | Vegan meal planning, legume and grain focus |
This macro target table is a general reference. Your personal needs may differ based on activity level, metabolism, and professional guidance. Use the calculator's macro ratio chart to see where your recipe falls within these ranges and adjust ingredients accordingly.
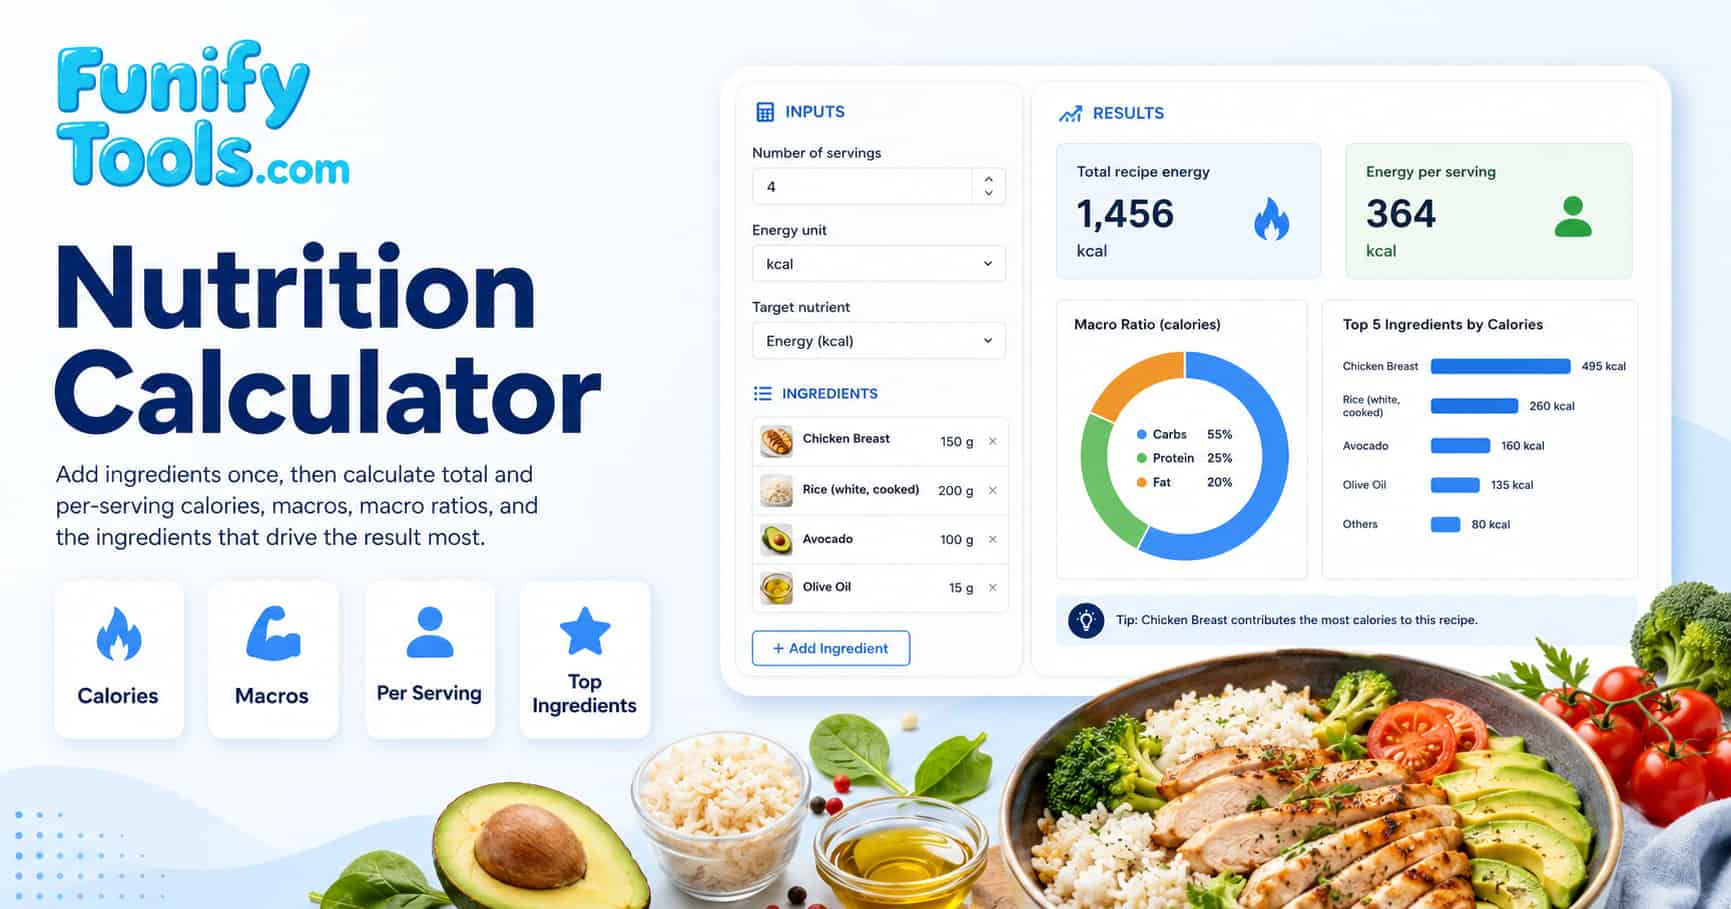
Interpreting the top 5 chart
The top 5 chart answers "what drives my recipe energy most?" Each bar shows one of the highest-energy ingredients, and the legend shows that ingredient's share of the displayed top five. If oil, nuts, cheese, or another dense ingredient dominates the chart, correcting that line changes the dish quickly. The chart updates instantly every time you recalculate, so you can test substitutions and see the visual shift without extra work.
The chart is also helpful for recipe development. When one ingredient dominates calories, you can test a smaller amount, a leaner substitute, or a different serving count. When protein is spread across several ingredients, the recipe may be more resilient because removing one item does not collapse the whole macro profile. This insight helps you plan substitutions and build recipes that stay balanced even when you swap one ingredient for another.
Assumptions and what is not included
- Energy is shown as kcal or kJ. Macro grams do not change with that toggle.
- Vitamin and mineral lists are informational only, not clinical dosing.
- Accuracy depends on your weighing and the values you enter.
- Databases may differ from your brand's label. Override when needed.
References
USDA FoodData Central | Wikipedia Nutrition | Wikipedia Food energy